Executive Summary
The 22nd State of Preschool finds that state initiatives propelled early childhood education (ECE) in the United States to historic highs during the 2023-2024 school year. Nationally, preschool recovered from the devastating impacts of the COVID-19 pandemic. Yet, progress has been highly uneven from state to state. While many states advanced by enrolling more children in quality preschool, others lagged, funding no preschool or only low quality programs. As federal cutbacks in education and elsewhere are being implemented, it is notable that federal COVID-19 recovery funding played a crucial role in sustaining and advancing preschool, and other federal funds underpin state programs and decrease inequality among the states in access to quality preschool education.
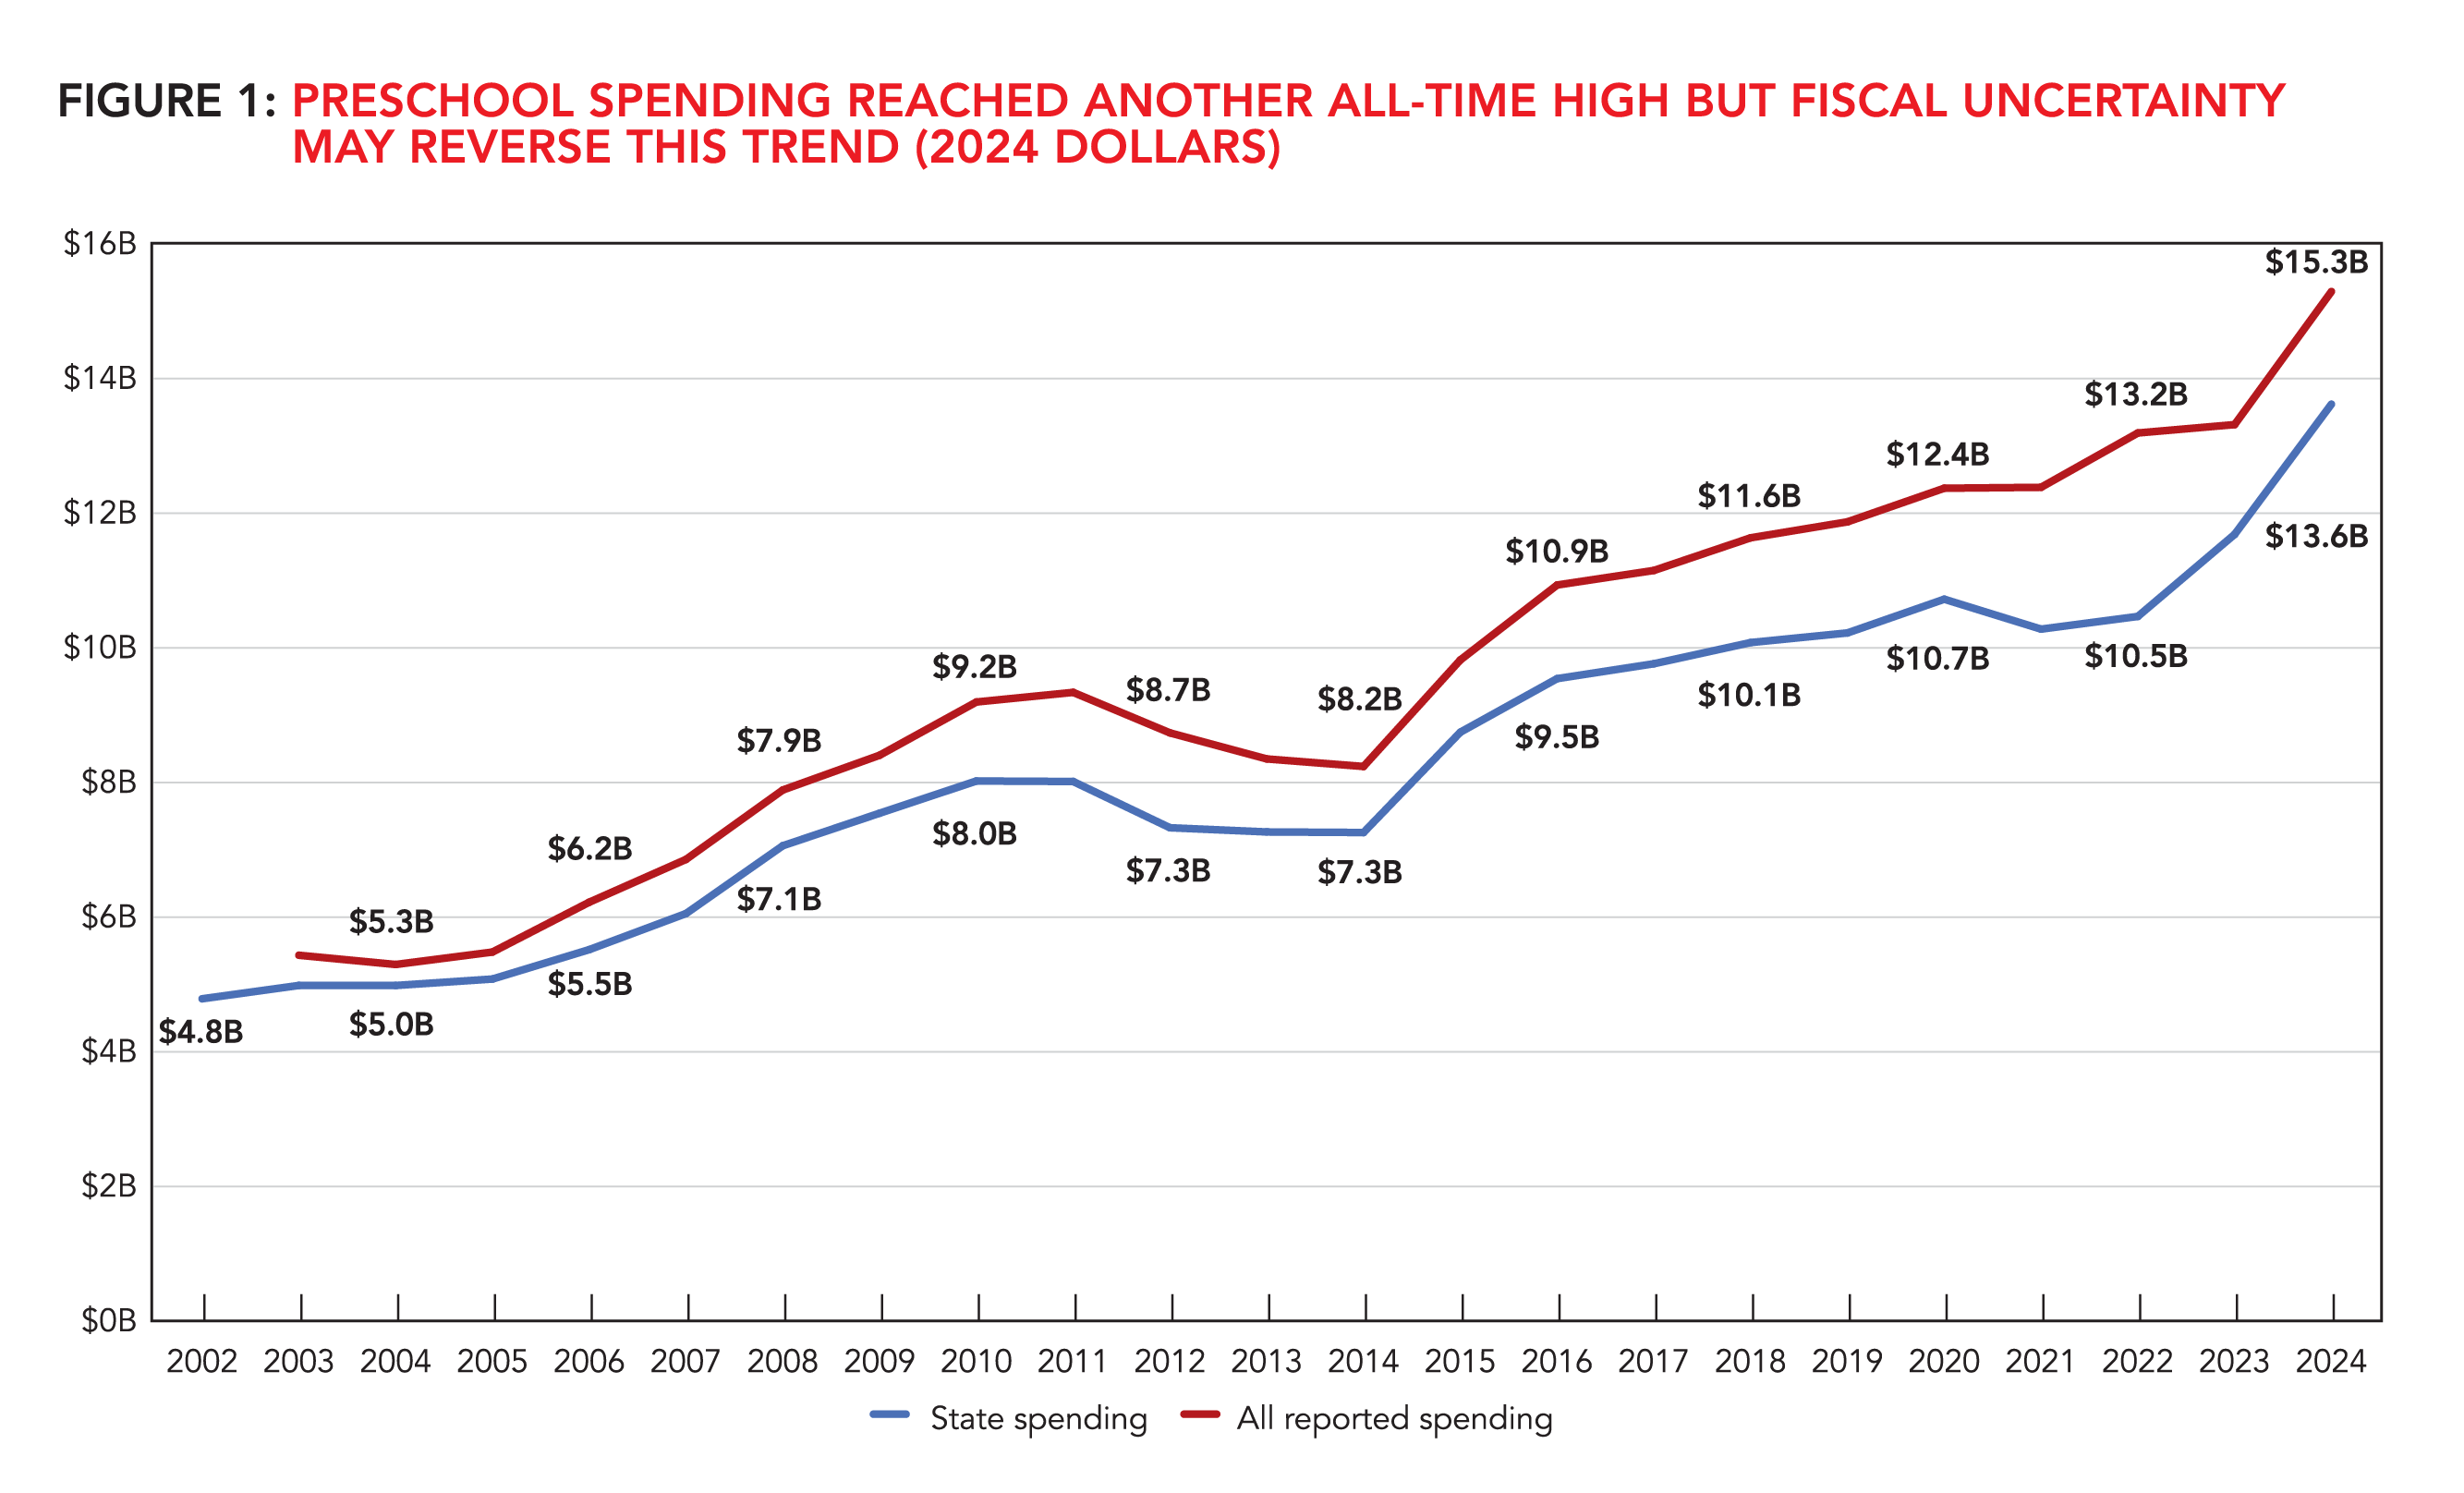
Changes in the national policy environment increase the importance of state leadership in pre-K. Federal leadership in pre-K has receded for some time, and this trend will continue in the foreseeable future. There is an additional risk that funding for federal ECE programs will be cut, reducing pre-K access for children in low-income families. This report provides state leaders with the information they need to fully understand the importance of federal ECE funding for their states. Of course, state leaders also are aware that any cuts in federal funding to states (e.g., Medicaid) have the potential to impact their budgets. In addition, states should be wary of negative impacts from a potential economic downturn. As can be seen in Figure 1, the Great Recession of 2008 led to lower pre-K funding for more than half a decade, though pre-K funded through K-12 formulas withstood the recession better than other pre-K programs. In these uncertain times, states can take control of their own destinies with policies that preserve and even increase smart investments in pre-K that pay-off far into the future. States can learn much about how to do this from each other, especially from the bi-partisan mix of very different states we identify as leaders in pre-K (see pullout section).
Historic Progress
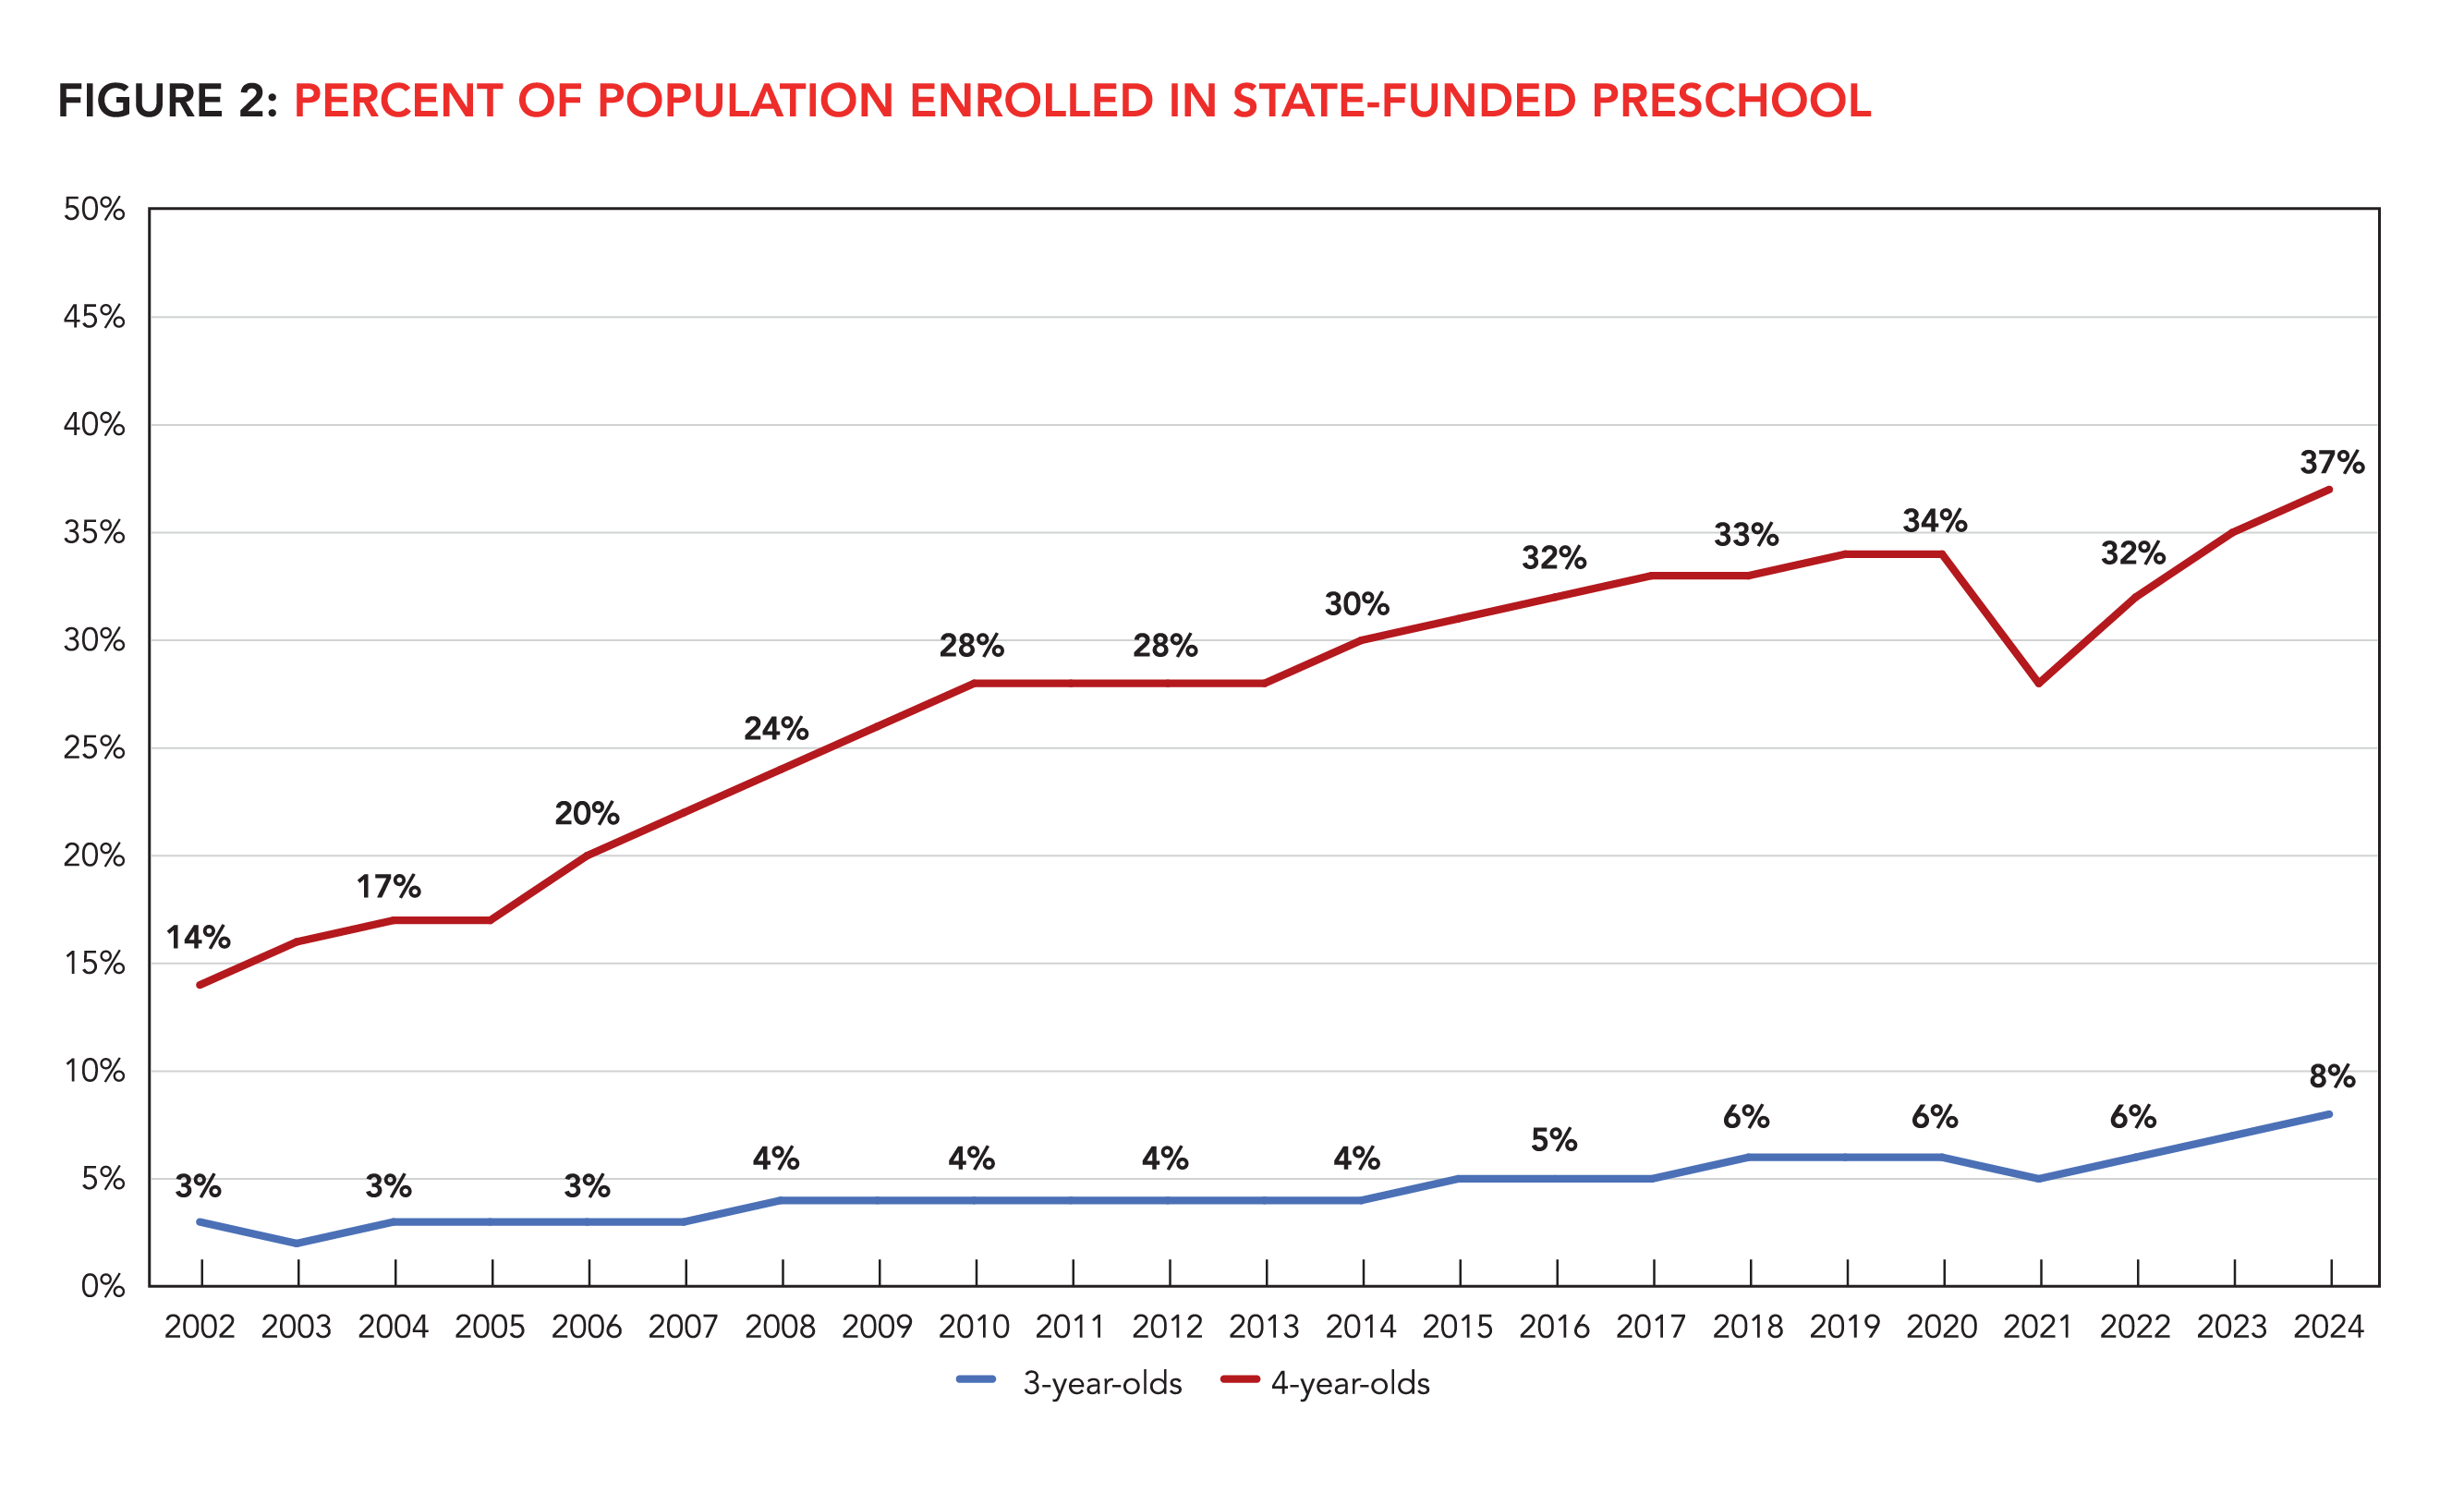
The 2023-2024 school year set new records for state-funded preschool enrollment and funding. Enrollment reached 1,751,109 children, an increase of 111,243 children, up 7% from the prior year. Enrollment reached all-time highs in total children and in the number and percentage of both 3- and 4-year-olds enrolled (See Figure 2). The total number of children enrolled in preschool increased in most states, but states working towards universal pre-K accounted for most of the nation’s progress (See Tables 3A & 3B). Enrollment increased by more than 30,000 children in two states: California and Colorado, both of which have ambitious plans for universal preschool. These two states account for 60% of the national increase in enrollment. Ten states increased enrollment by more than 20%: Alaska, Colorado, Delaware, Hawaii, Mississippi, Missouri, Nevada, New Mexico, North Dakota, and Ohio.
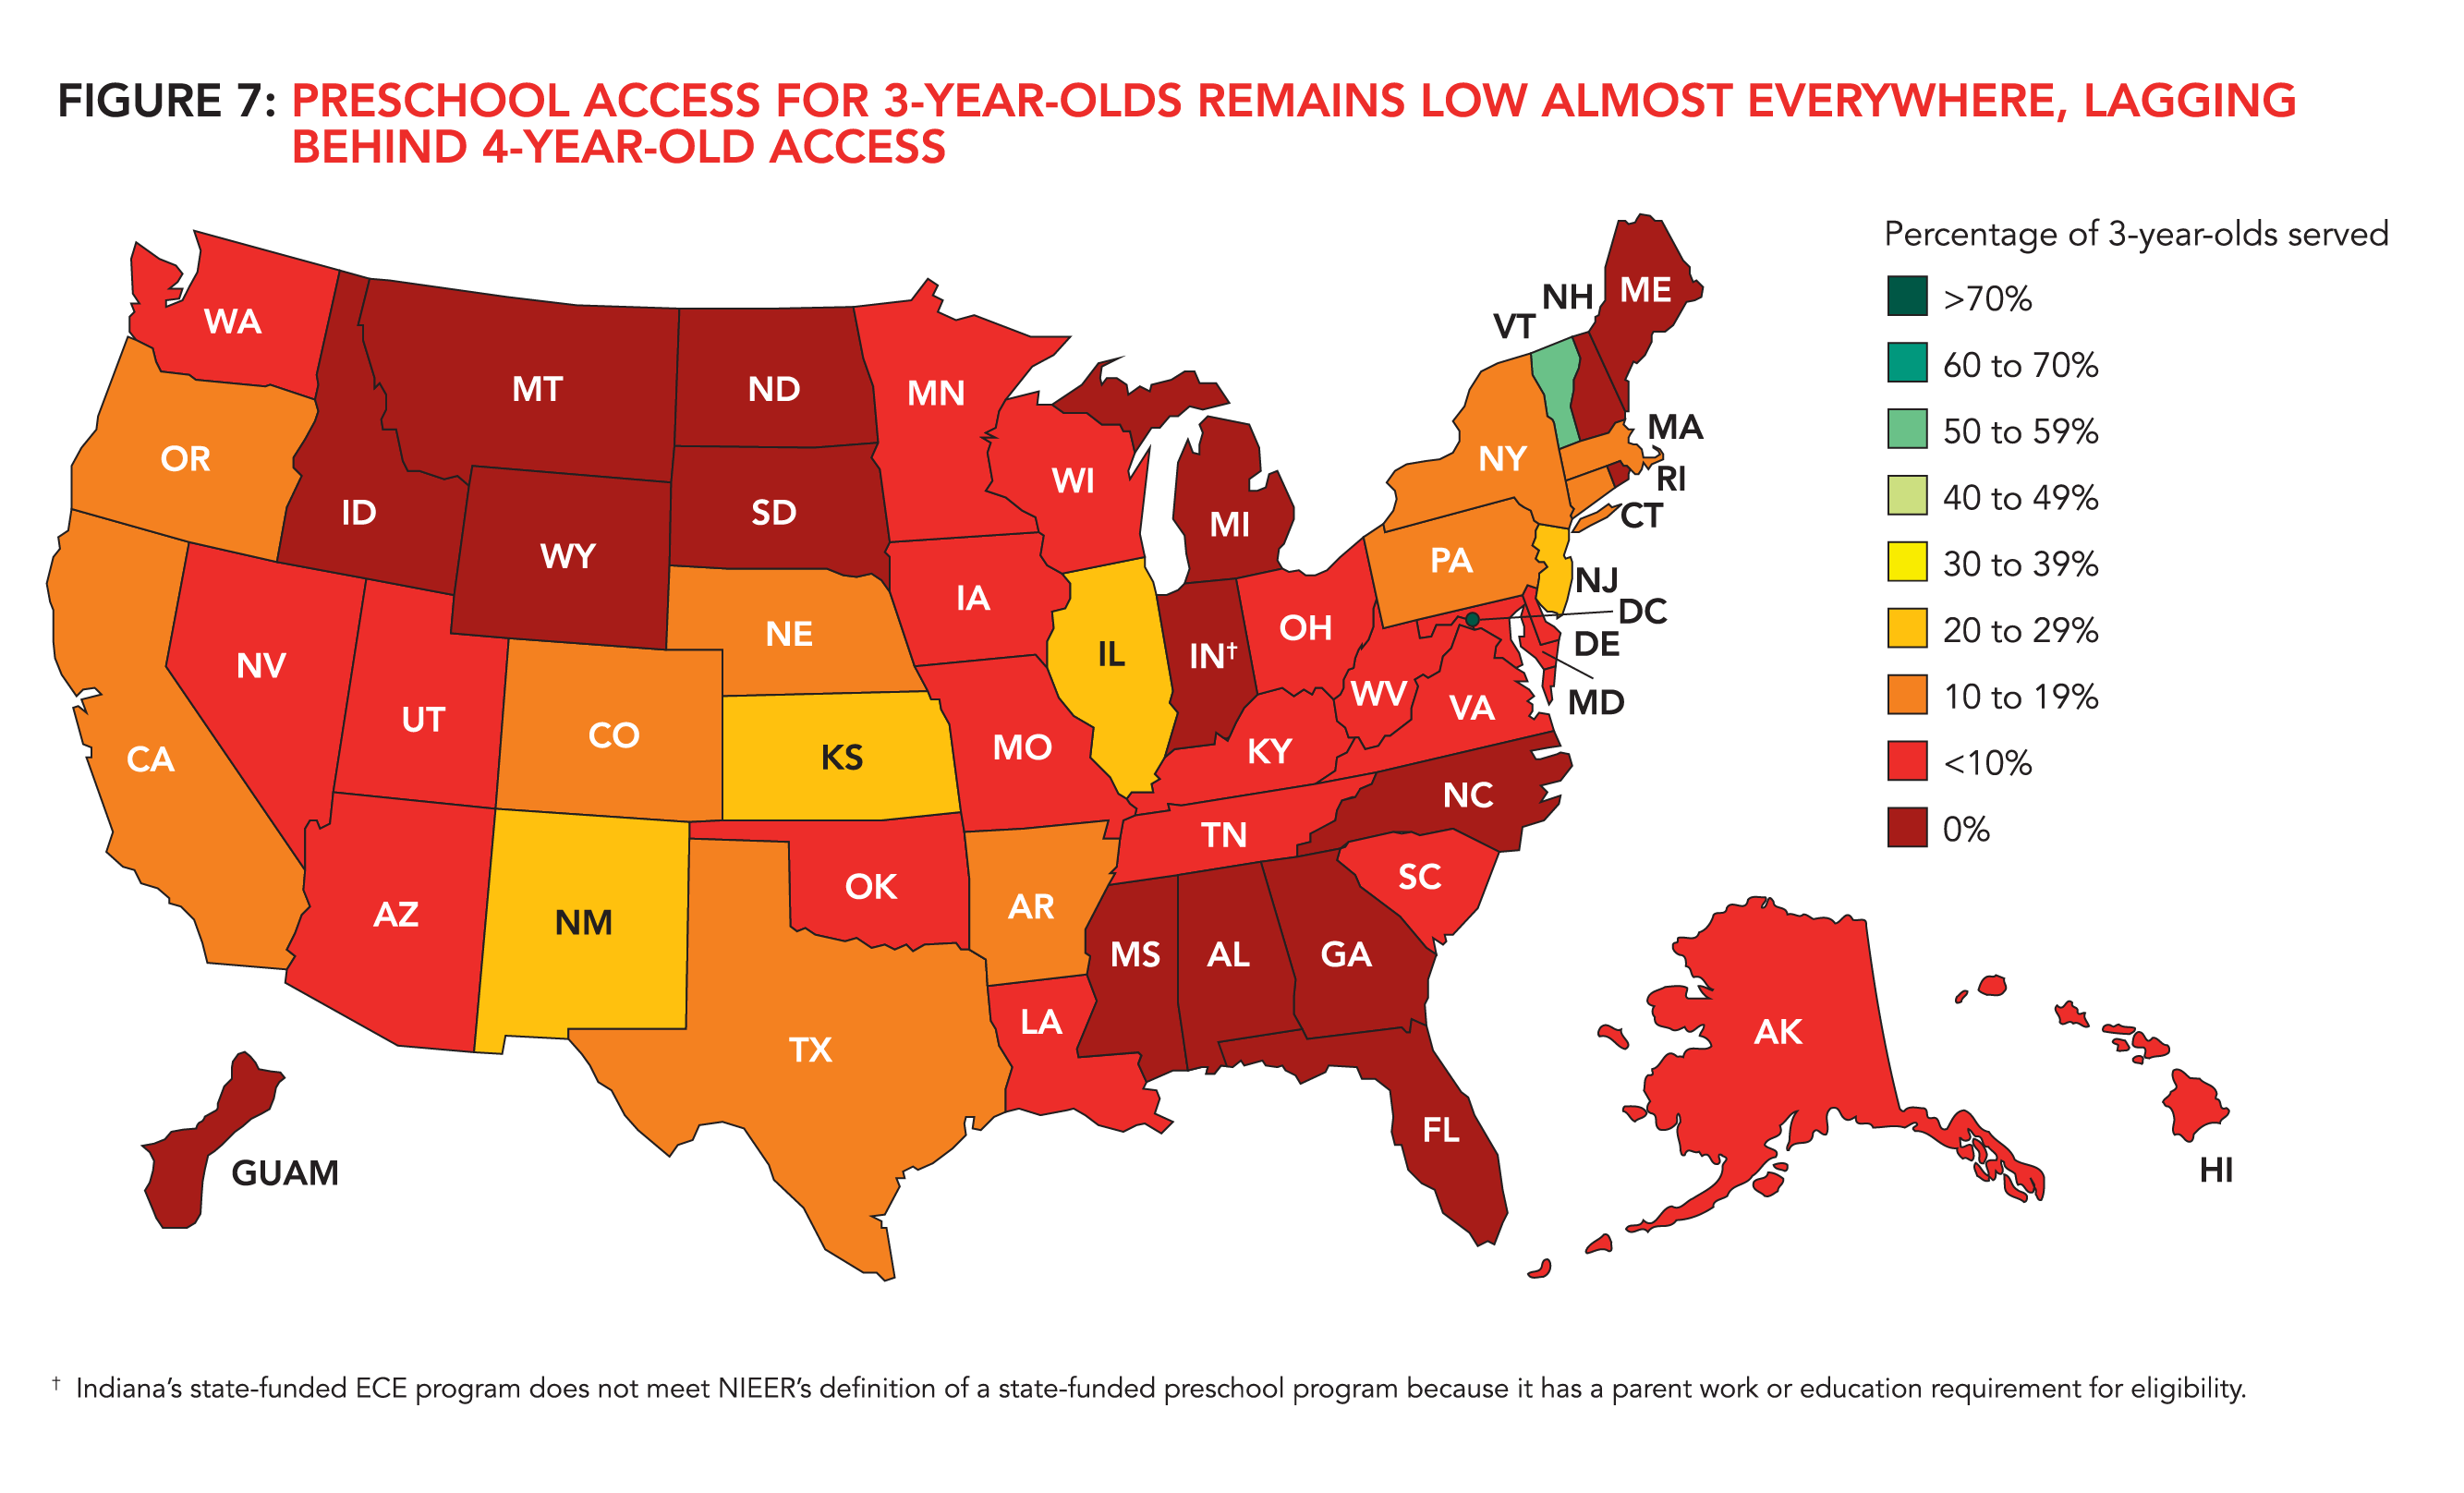
Most state pre-K programs continue to primarily or only serve 4-year-olds despite some increases in enrollment at age 3. Enrollment reached 8% of 3-year-olds and 37% of 4-year-olds, nationally.
Funding for state-funded preschool also reached record highs in the 2023-2024 school year. States spent more than $13.6 billion (including $257 million in federal COVID-19 relief funding) on preschool, an inflation-adjusted increase of almost $2 billion (17%). State spending on preschool increased in all except five states with a preschool program. Six states increased state spending on preschool, adjusted for inflation, by more than $100 million over the prior year: California, Colorado, Maryland, New Jersey, New Mexico, and Texas. All reported funding (state, local, and federal) supporting state preschool topped $15.3 billion, another all-time high.
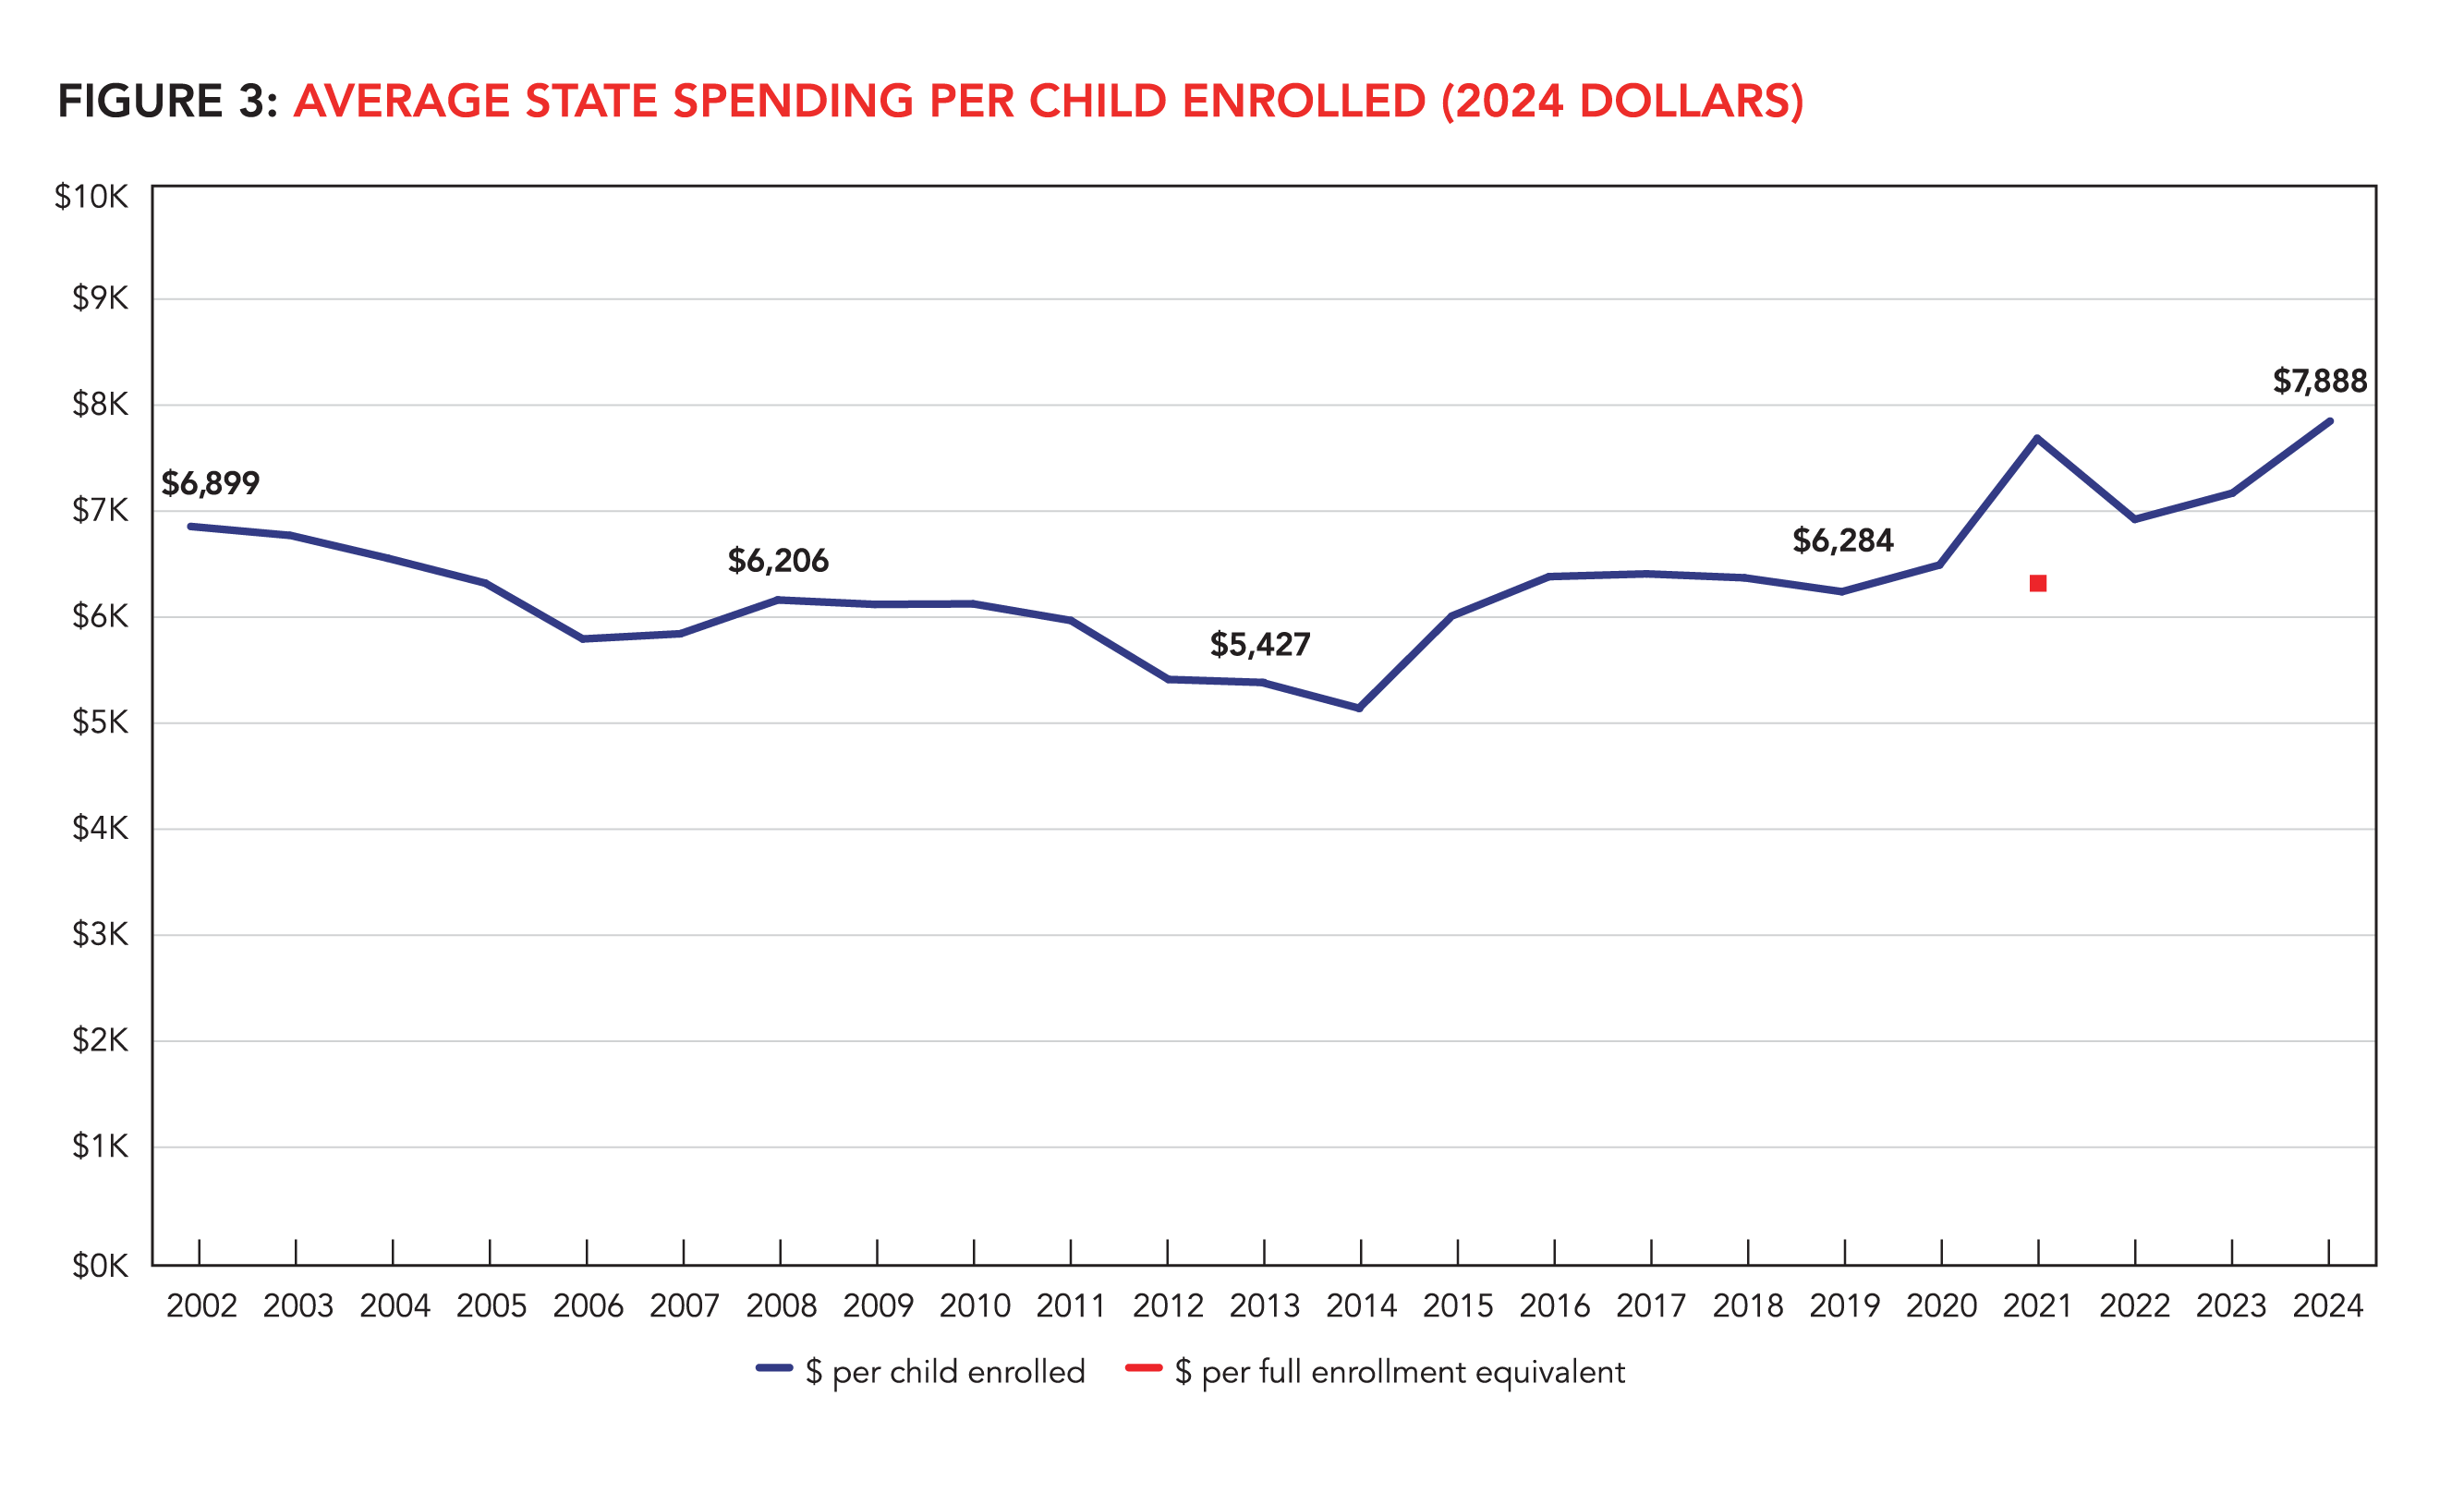
Like last year, preschool spending increased by a larger percentage than enrollment. State spending per child enrolled reached $7,888, another record high and an inflation-adjusted increase of $675 from the prior year (See Figure 3). State spending per child increased in all but eight states with a preschool program. Five states increased spending per child by more than $2,500, adjusted for inflation: Arizona, Delaware, Maryland, New Mexico, and Oregon. This group includes states with new preschool initiatives and states that raised spending per child to support program quality. Including state, local, and federal sources, spending per child was $8,857, an inflation-adjusted increase of $636, reflecting a strong increase in state funding during a time of declining federal recovery dollars.
Uneven Progress
Underlying the historically positive national picture is tremendous variation by state. While some states moved rapidly ahead, others made little or no progress. Five states have no state-funded preschool program, and many others serve very few children, spend too little per child, and/or have such low standards for quality that their programs provide little support for the gains in learning and development needed for investments in pre-K to payoff for children and taxpayers.
Since the onset of the COVID-19 pandemic, the national percentage of 4-year-olds enrolled in pre-K has increased from 34% to 37% while the percentage of 3-year-olds enrolled increased from 6% to 8%. But almost half of states with a preschool program (22) enrolled fewer children in fall 2023 than fall 2019 and 14 states served a lower percentage of 3- and 4-year-olds in fall 2023 than fall 2019 (See Tables 3A & 3B). As noted earlier, most of the national progress was concentrated in a handful of states — California, Colorado, Kansas, New York, Ohio — while others have fallen further behind — Florida, Georgia, Oklahoma, Wisconsin.
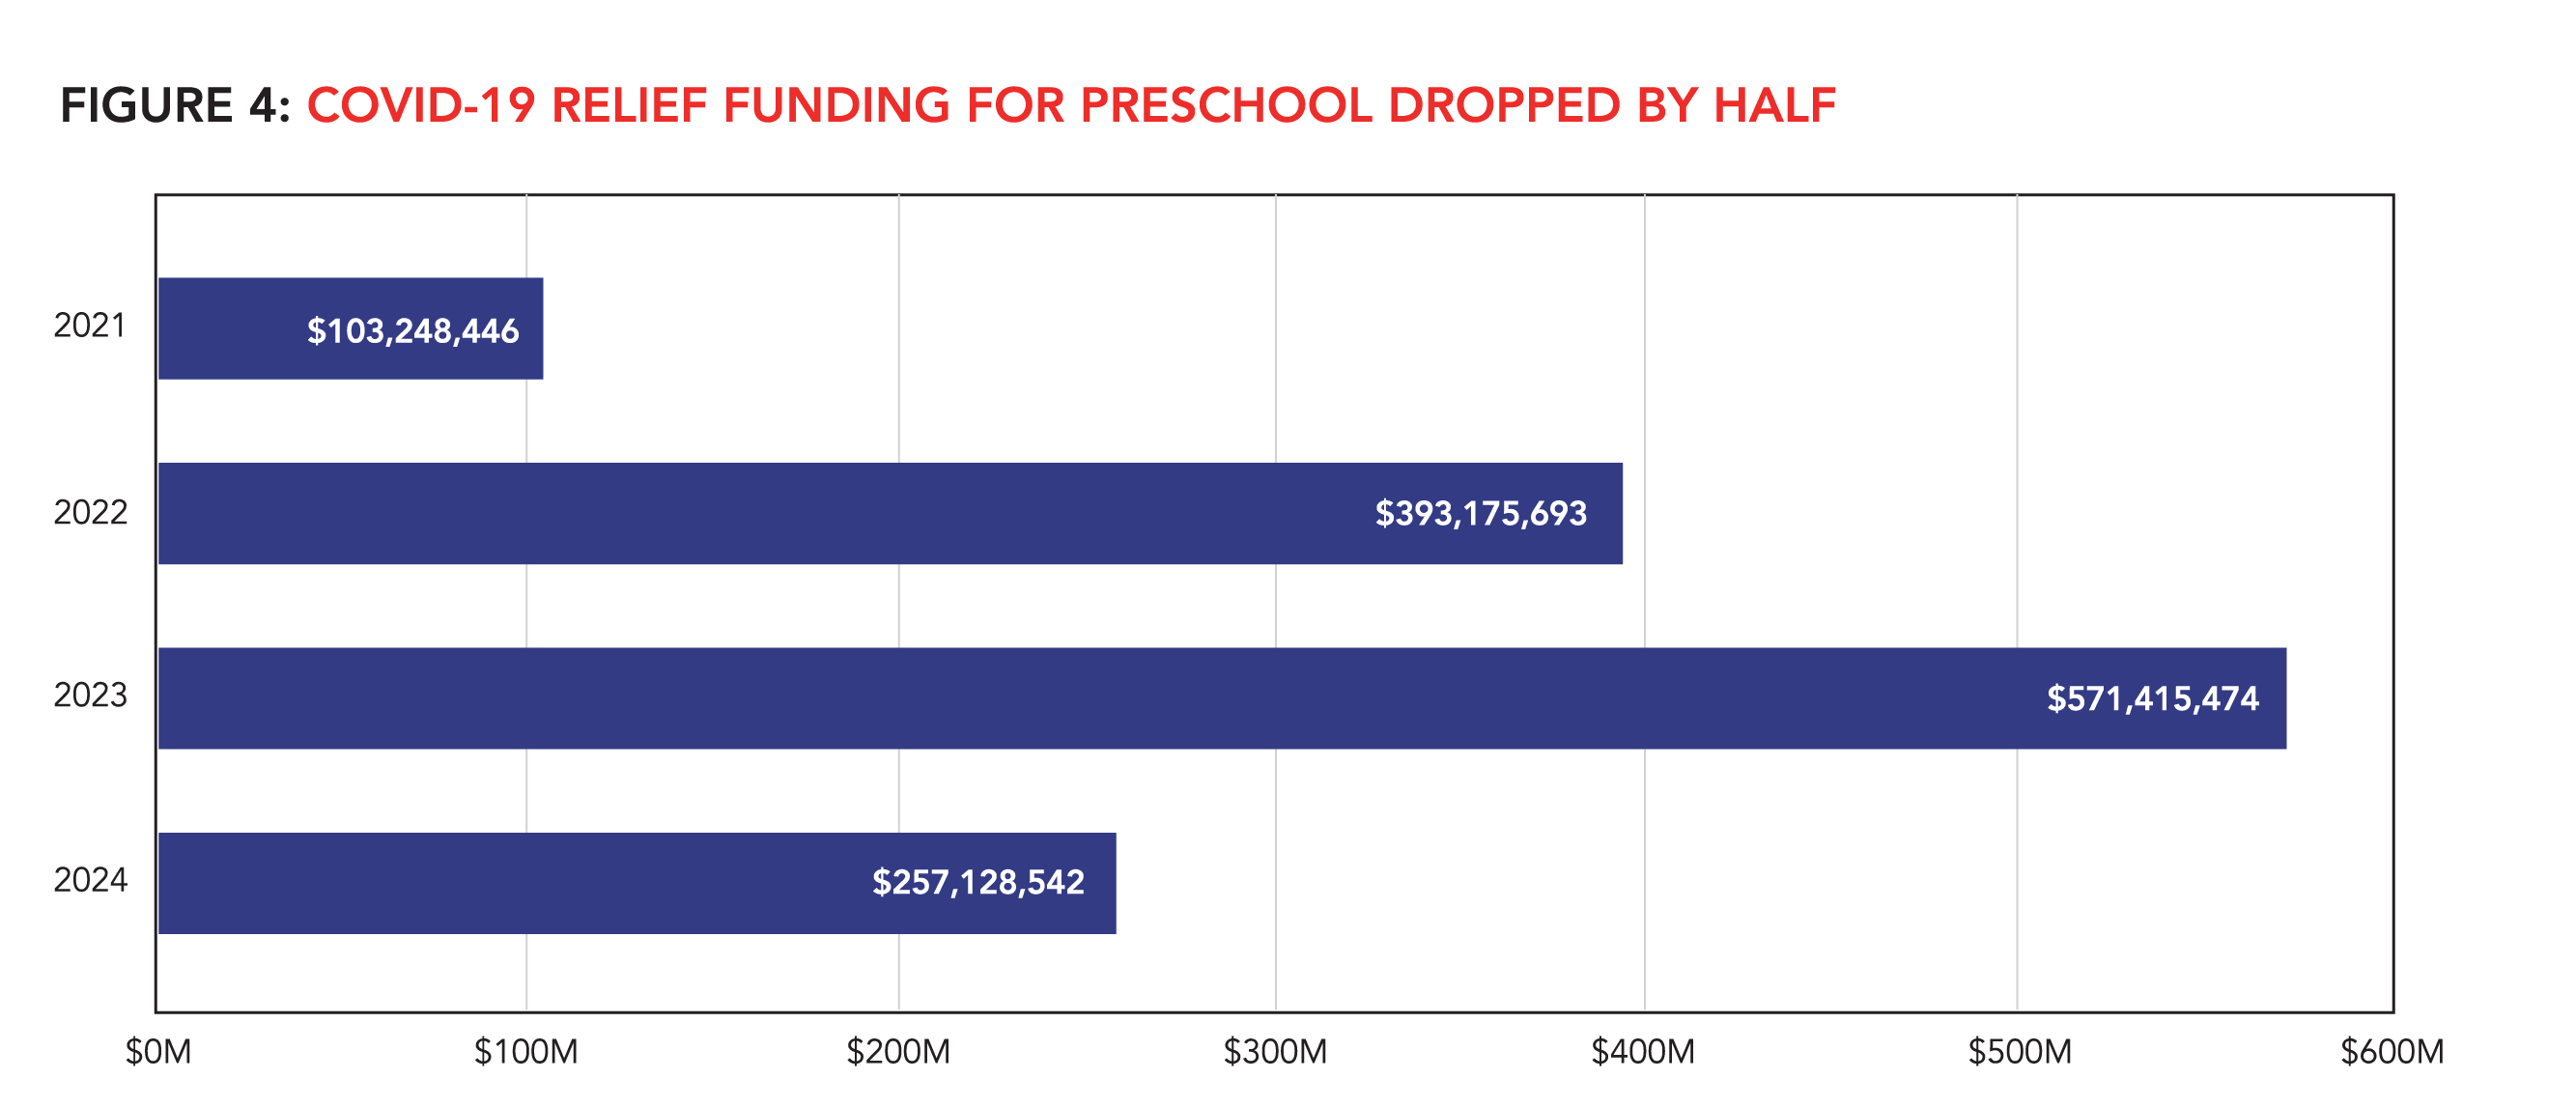
State spending for preschool increased by $2.9 billion from before the COVID-19 pandemic to the 2023-2024 school year, and state spending per child increased by $1,353 (adjusted for inflation). Notably, many states utilized federal COVID-19 relief funds to help stabilize and even expand their preschool programs. During the 2020-2021, 2021-2022, 2022-2023, and 2023-2024 school years, a total of 34 of 45 states with preschool programs reported using COVID-19 relief funding to support preschool. States reported using more than $1.3 billion in COVID-19 relief funds over those four years, though this is likely an underestimate as many states could not report the amount of funding. In 2023-2024, states reported approximately $257 million in COVID-19 relief funding, less than half of what they spent in 2022-2023 (See Figure 4). Many states have used state funds to fill in the gap left by COVID-19 relief funding (like Michigan, North Dakota, and Rhode Island) but others have seen decreases in overall preschool funding (like Arkansas and Florida).
Where Improvement is Most Needed: Quality Standards
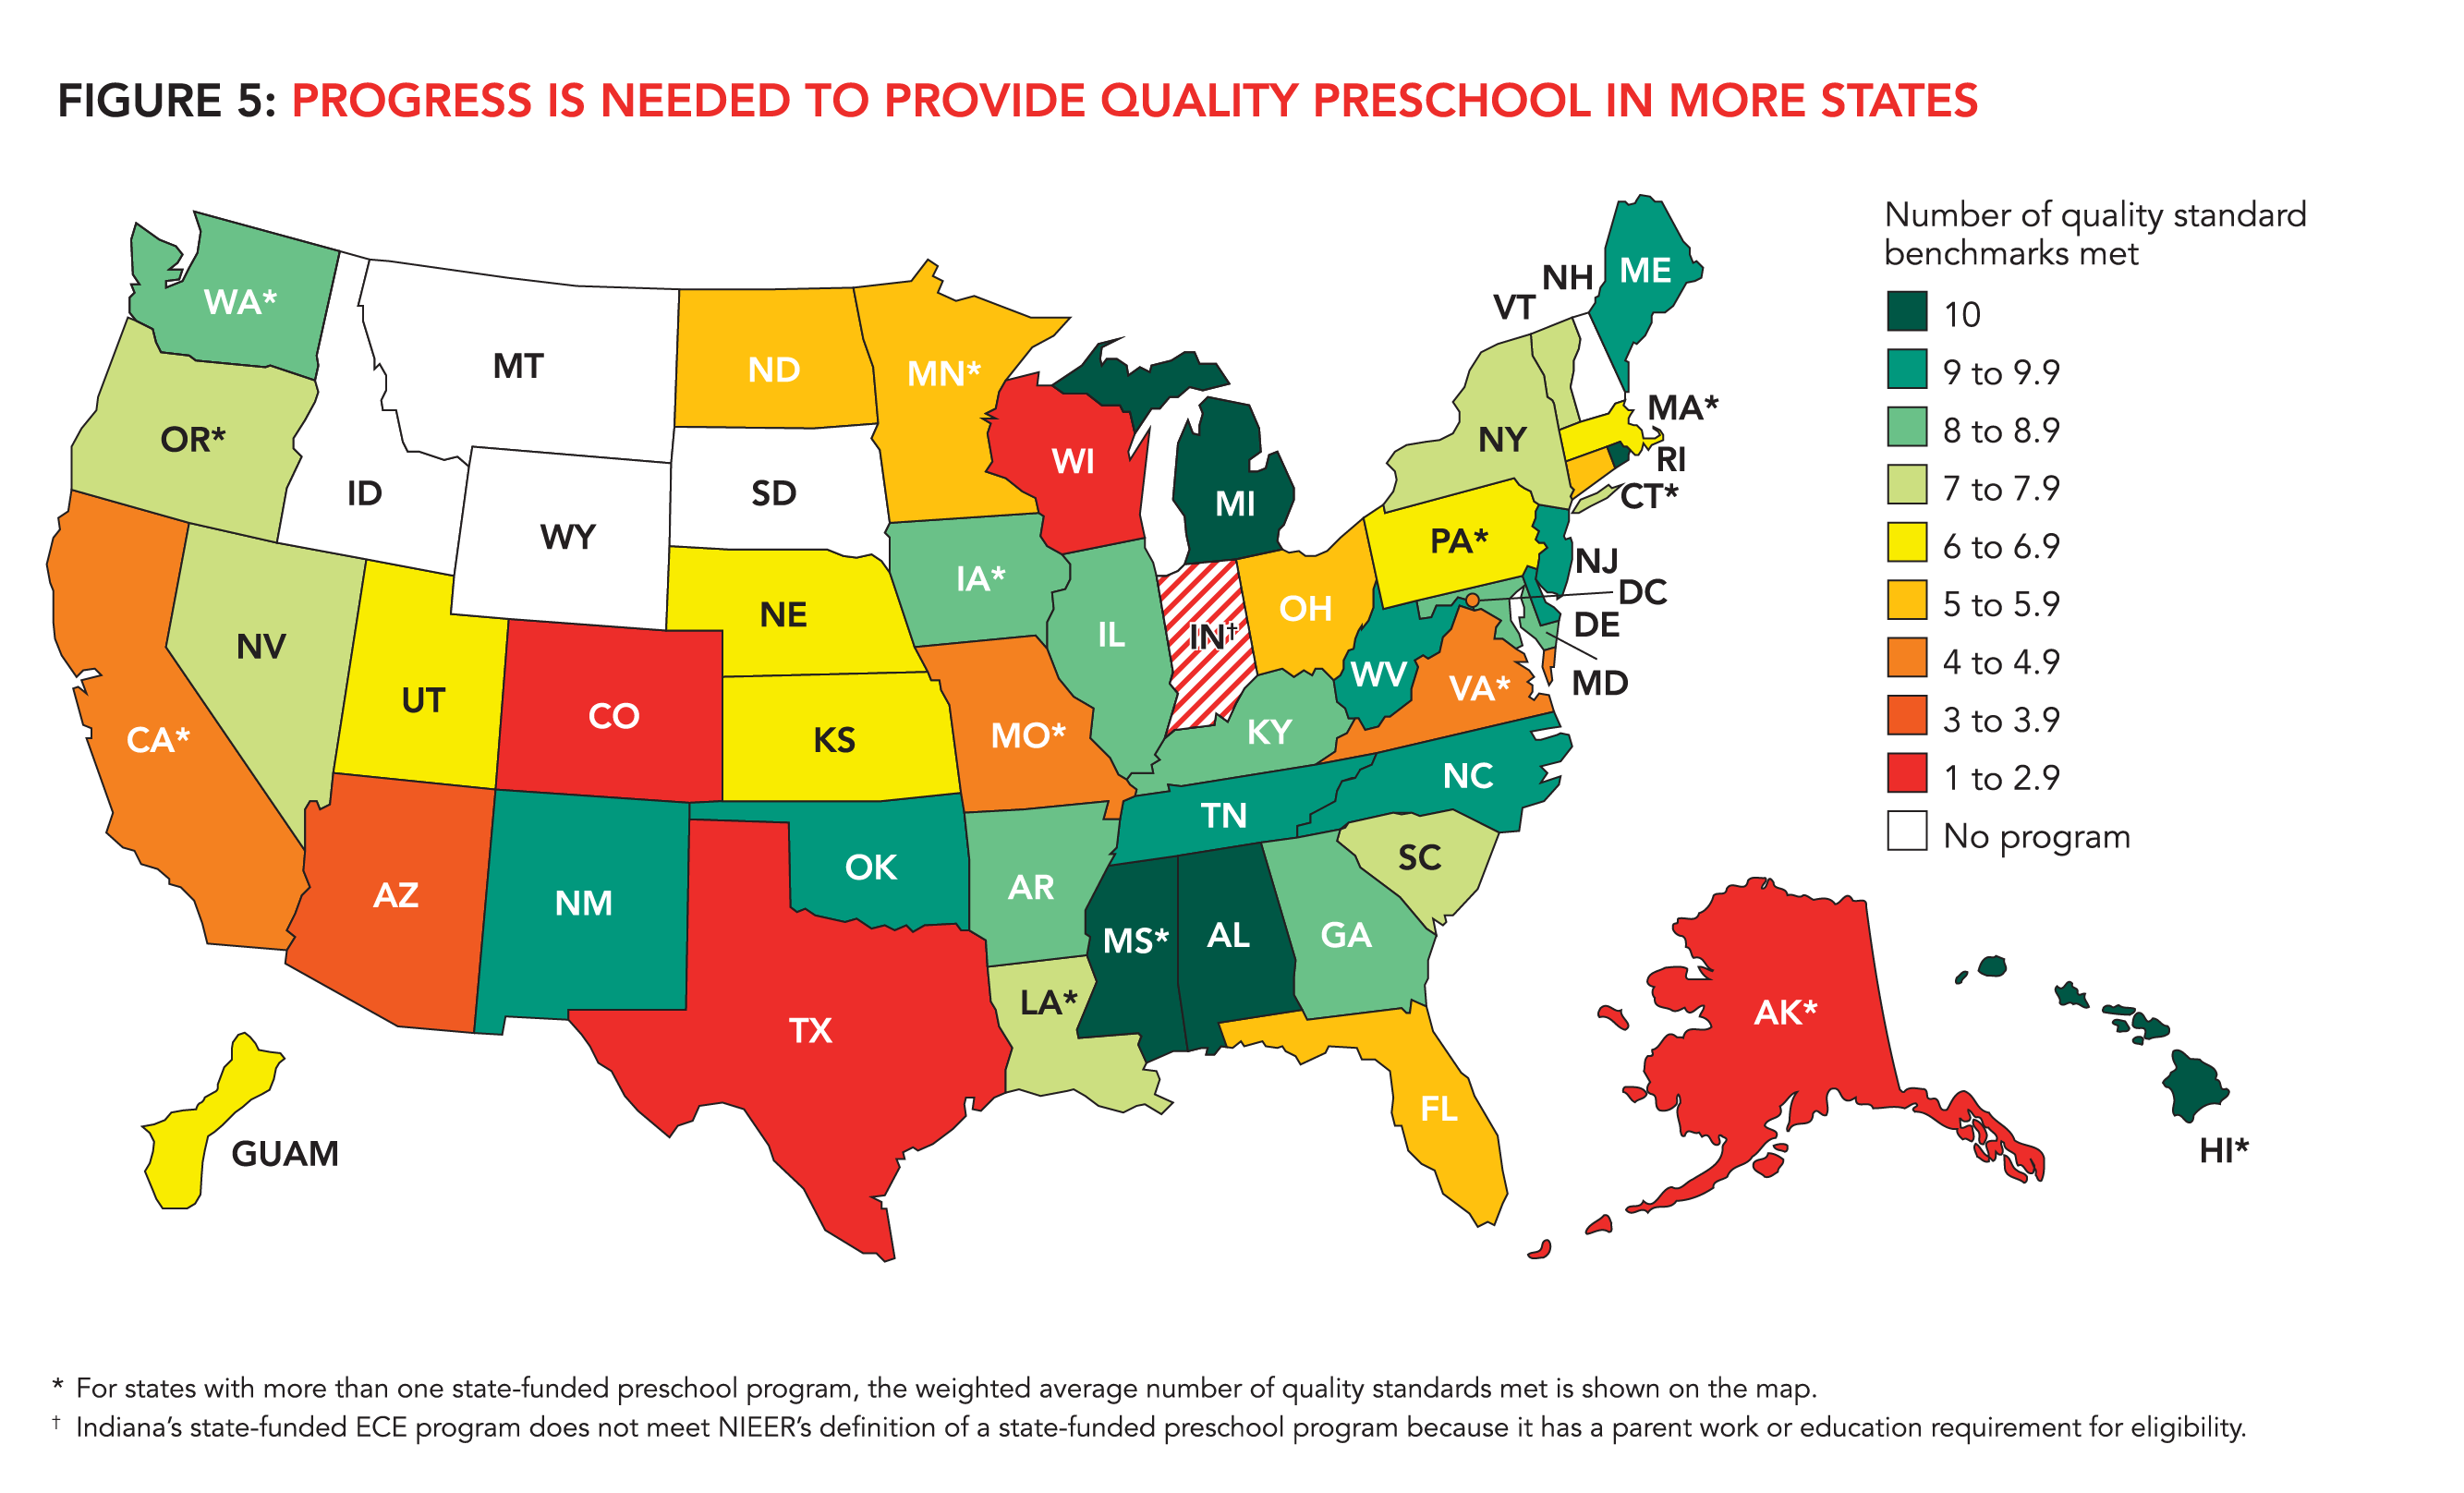
Standards for quality are too low in most programs (See Figure 5), and improvements have been few and far between. Instead, some states rolled back standards recently. Texas no longer requires a bachelor’s degree and P-6 certification for preschool teachers in public schools. North Carolina raised class sizes from 18 to 20 and increased ratios from 1:9 to 1:10 beginning in the 2023-2024 school year. Many states with policies requiring lead preschool teachers to have at least a bachelor’s degree report higher numbers of lead preschool teachers who do not have the degree because waivers have increased amid recent workforce shortages. Georgia stands out most recently for moving in the right direction on quality by reducing class size and improving teacher-child ratios starting in the 2024-2025 school year and providing lead and assistant teachers with raises.
Between the 2022-2023 and 2023-2024 school years, only one state had a policy change that resulted in an additional benchmark being met: Utah met the Early Learning and Development Standards (ELDS) benchmark for the first time. Three states moved in the other direction, with policy changes that reduced the number of quality standards benchmarks met (Nebraska, Texas, and Virginia).
When states put money into quality programs they are investing in children’s futures and can expect to see returns on their investments. Low spending results in low quality. While that may seem to save money, it is wasteful and costly in the longrun to fund programs that do not adequately support long-term gains and may even harm long-term outcomes for some children. Investing in quality raises the cost of pre-K but results in a larger long-term net return. In 2023-2024, only 18 statefunded preschool programs met 9 or 10 of NIEER’s benchmarks for minimum program quality. Twenty-one programs met 5 or fewer. However, those 21 programs served 44% of children in state-funded preschool compared to only 16% in the higher quality programs.
Learning From Leading States
ENROLLMENT LEADERS
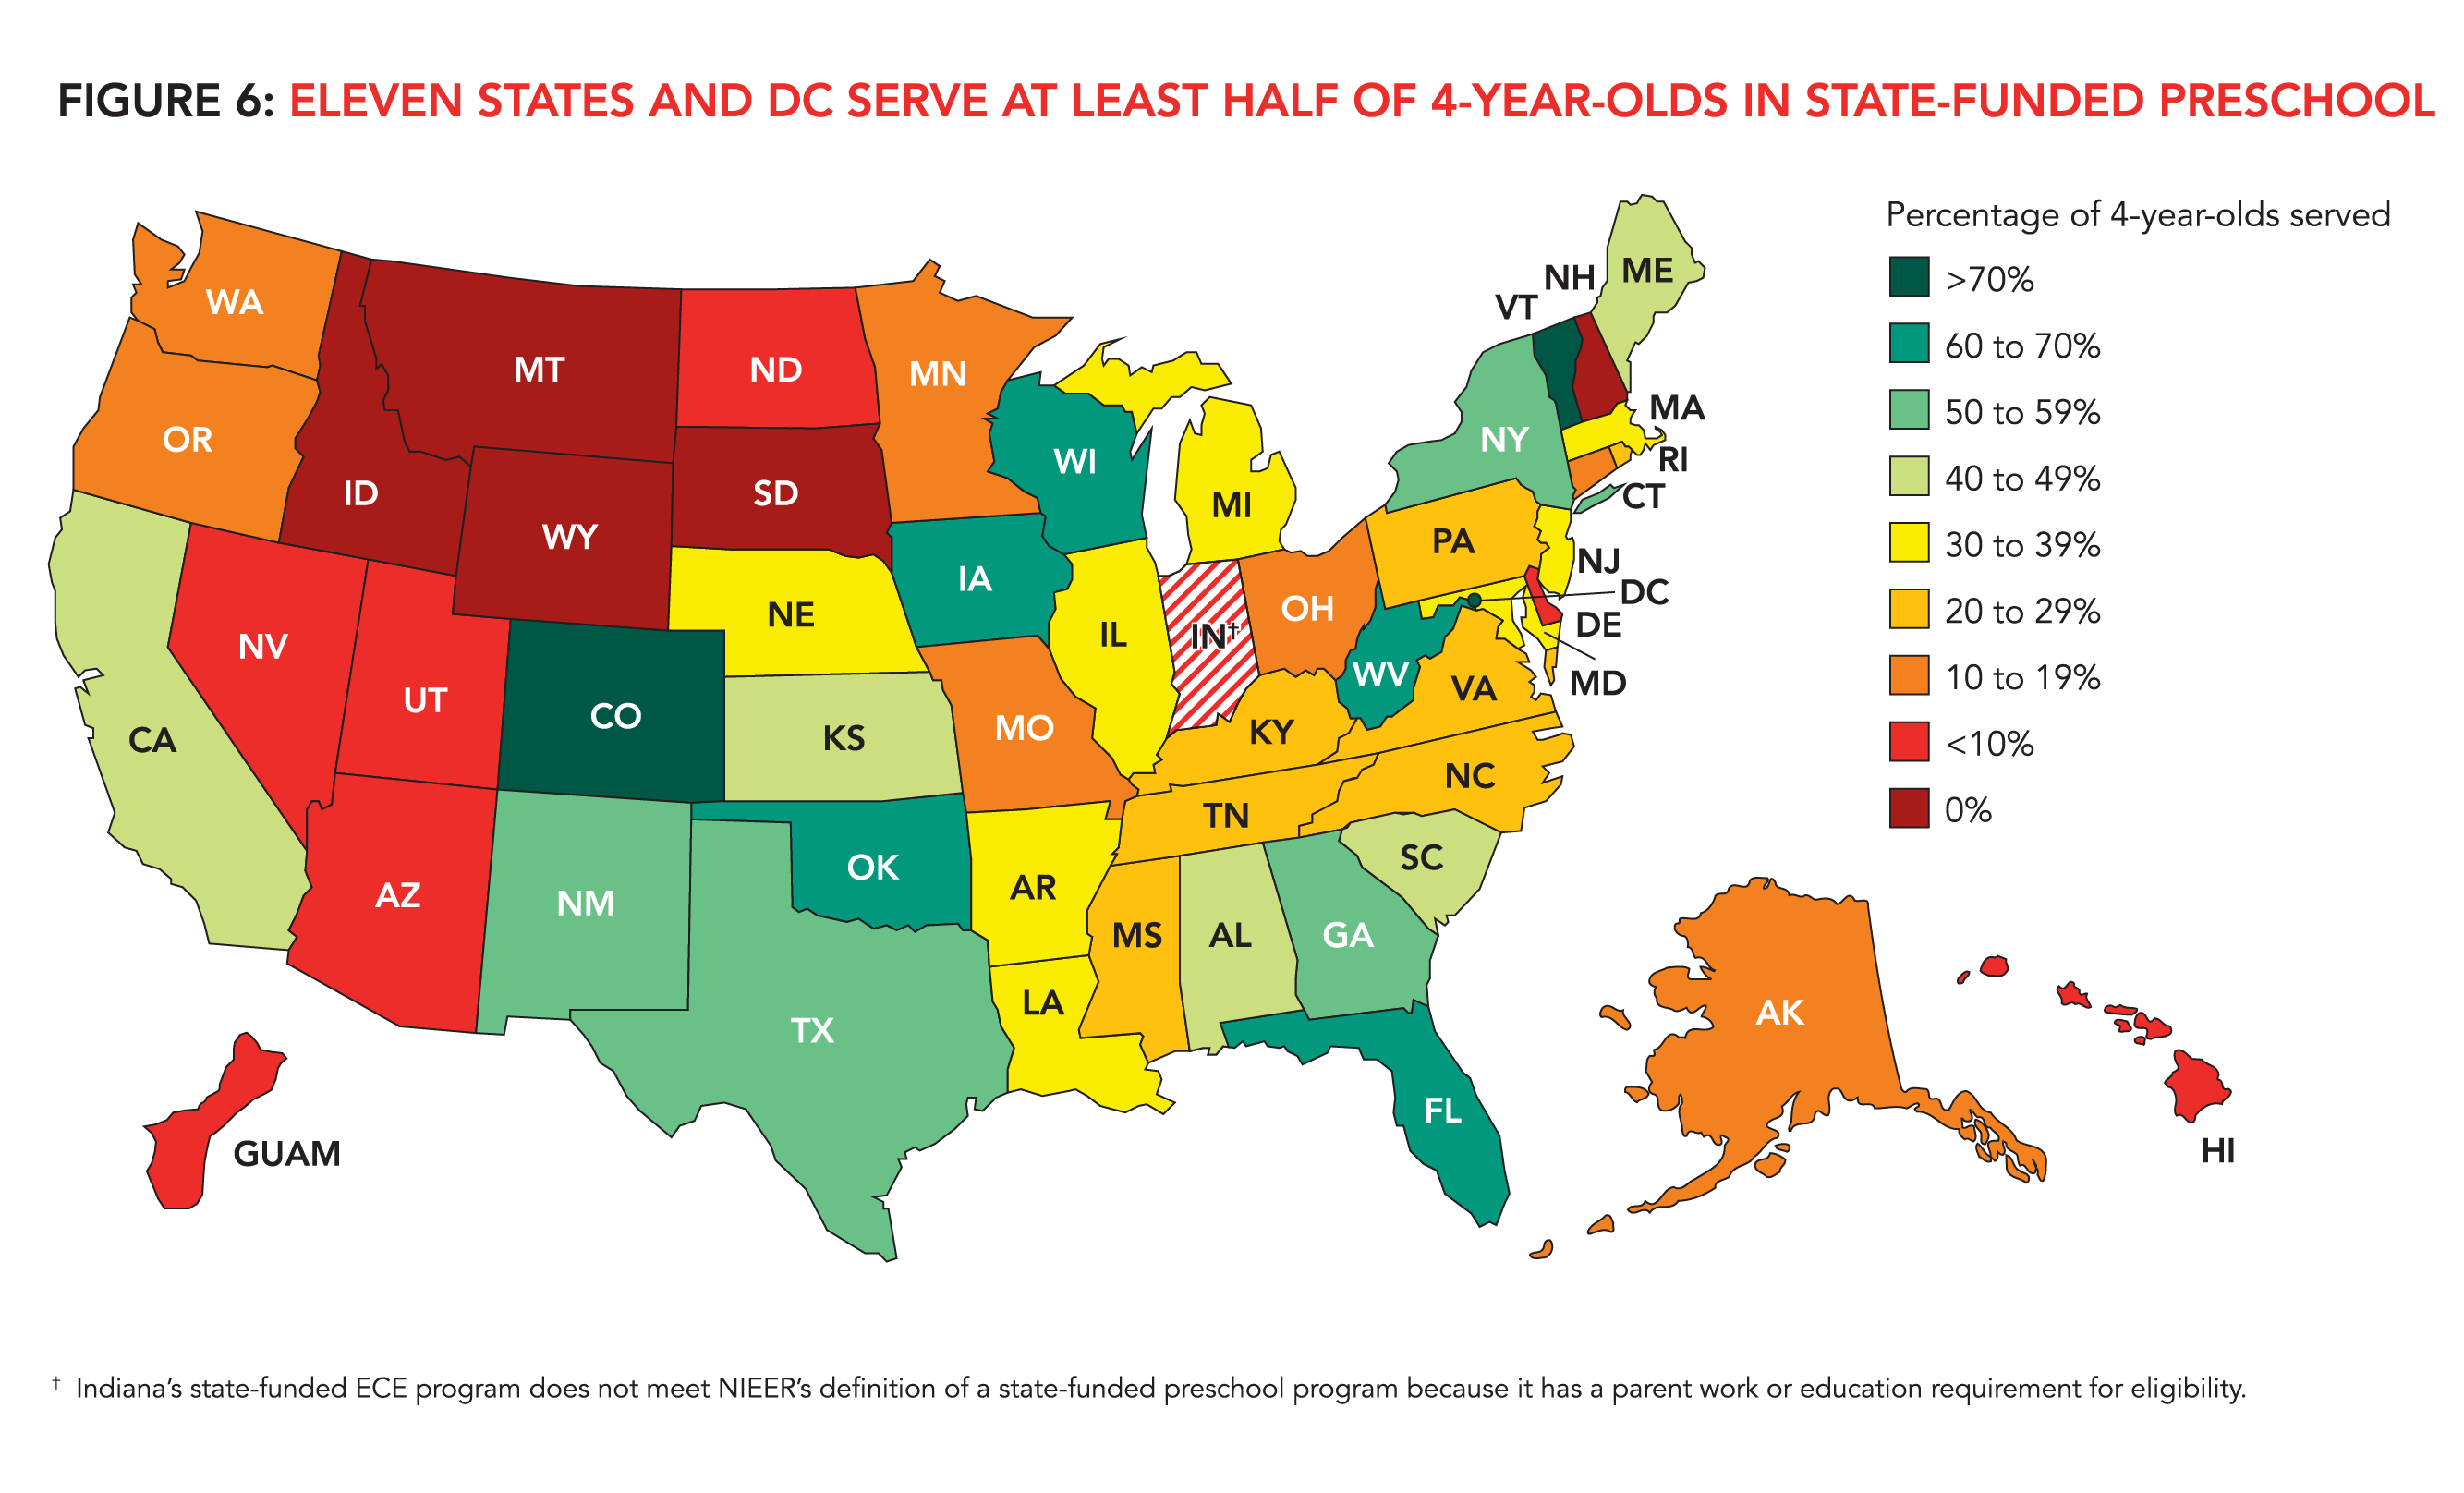
Two small “states” led the nation in access to quality pre-K. The District of Columbia enrolled 95% of 4-year-olds and 82% of 3-year-olds, far surpassing all states. Vermont followed, enrolling 76% of 4-year-olds and 58% of 3-year-olds (See Figures 6 and 7 and Table 2). Other states that standout for long-standing high levels of enrollment are Iowa and West Virginia. Colorado rocketed into third place in access for 4-year-olds as it rapidly expanded enrollment in a single year under its new universal preschool program, though quality standards are limited and are still being developed. California and New Mexico are other states with high rates of growth, and if they continue to expand at recent rates, they could enroll two-thirds of their 4-year-olds in the next few years.
An alarm is raised by enrollment trends in some states with universal pre-K programs where enrollment rates have not recovered since the pandemic and continued to decline into 2024. Why? Florida, Georgia, Oklahoma, and Wisconsin all had substantive enrollment declines since at least 2019-2020 (starting before the pandemic) and continued to decline in 2023-2024. Florida, Oklahoma, and Wisconsin all once enrolled more than 70% of 4-year-olds but now serve 63% to 66%. Georgia’s enrollment declined from a high of 61% to 55% of 4-year-olds. This could be related to a trend toward lower enrollment rates in public education more generally, but these pre-K enrollment rates are far below K-12 rates for public schools. Not all states with universal pre-K show this trend, but others, notably Iowa and West Virginia, seem “stuck” at 67% which is about the same as five years ago. This leads to a broader question. What enrollment rate should be expected for universal pre-K?
While the District of Columbia enrolls 95% of 4-year-olds, enrollment rates drop to 75% and even the low 60s for some states with “universal pre-K”. When preschool special education and federal Head Start are added, enrollment rates rise but remain well below the District’s high mark. A comparison of enrollment at age 4 to enrollment at ages 5 and 6 sheds lights on this issue: In 2022, nationally, 84% of 5-year-olds were enrolled in school, including 65% in public school program and 19% in private kindergarten. At age 6, when all children have access to free public education (some 5-year-olds are not yet old enough for kindergarten or are held back), nationally, 97% enrolled in school in 2022, including 87% in public school and 10% in private school.
Based on these enrollment rates for 5- and 6-year-olds, one could speculate that a universal public pre-K program might enroll only 65% of preschoolers, with Head Start and private (e.g., child care) enrollment raising the total to about 85%. However, why shouldn’t public programs expect to enroll 85% of 4-year-olds, with private providers raising enrollment rates to around 95% as is common for older children? This pattern would be more consistent with preschool enrollment rates in most other developed nations. 1
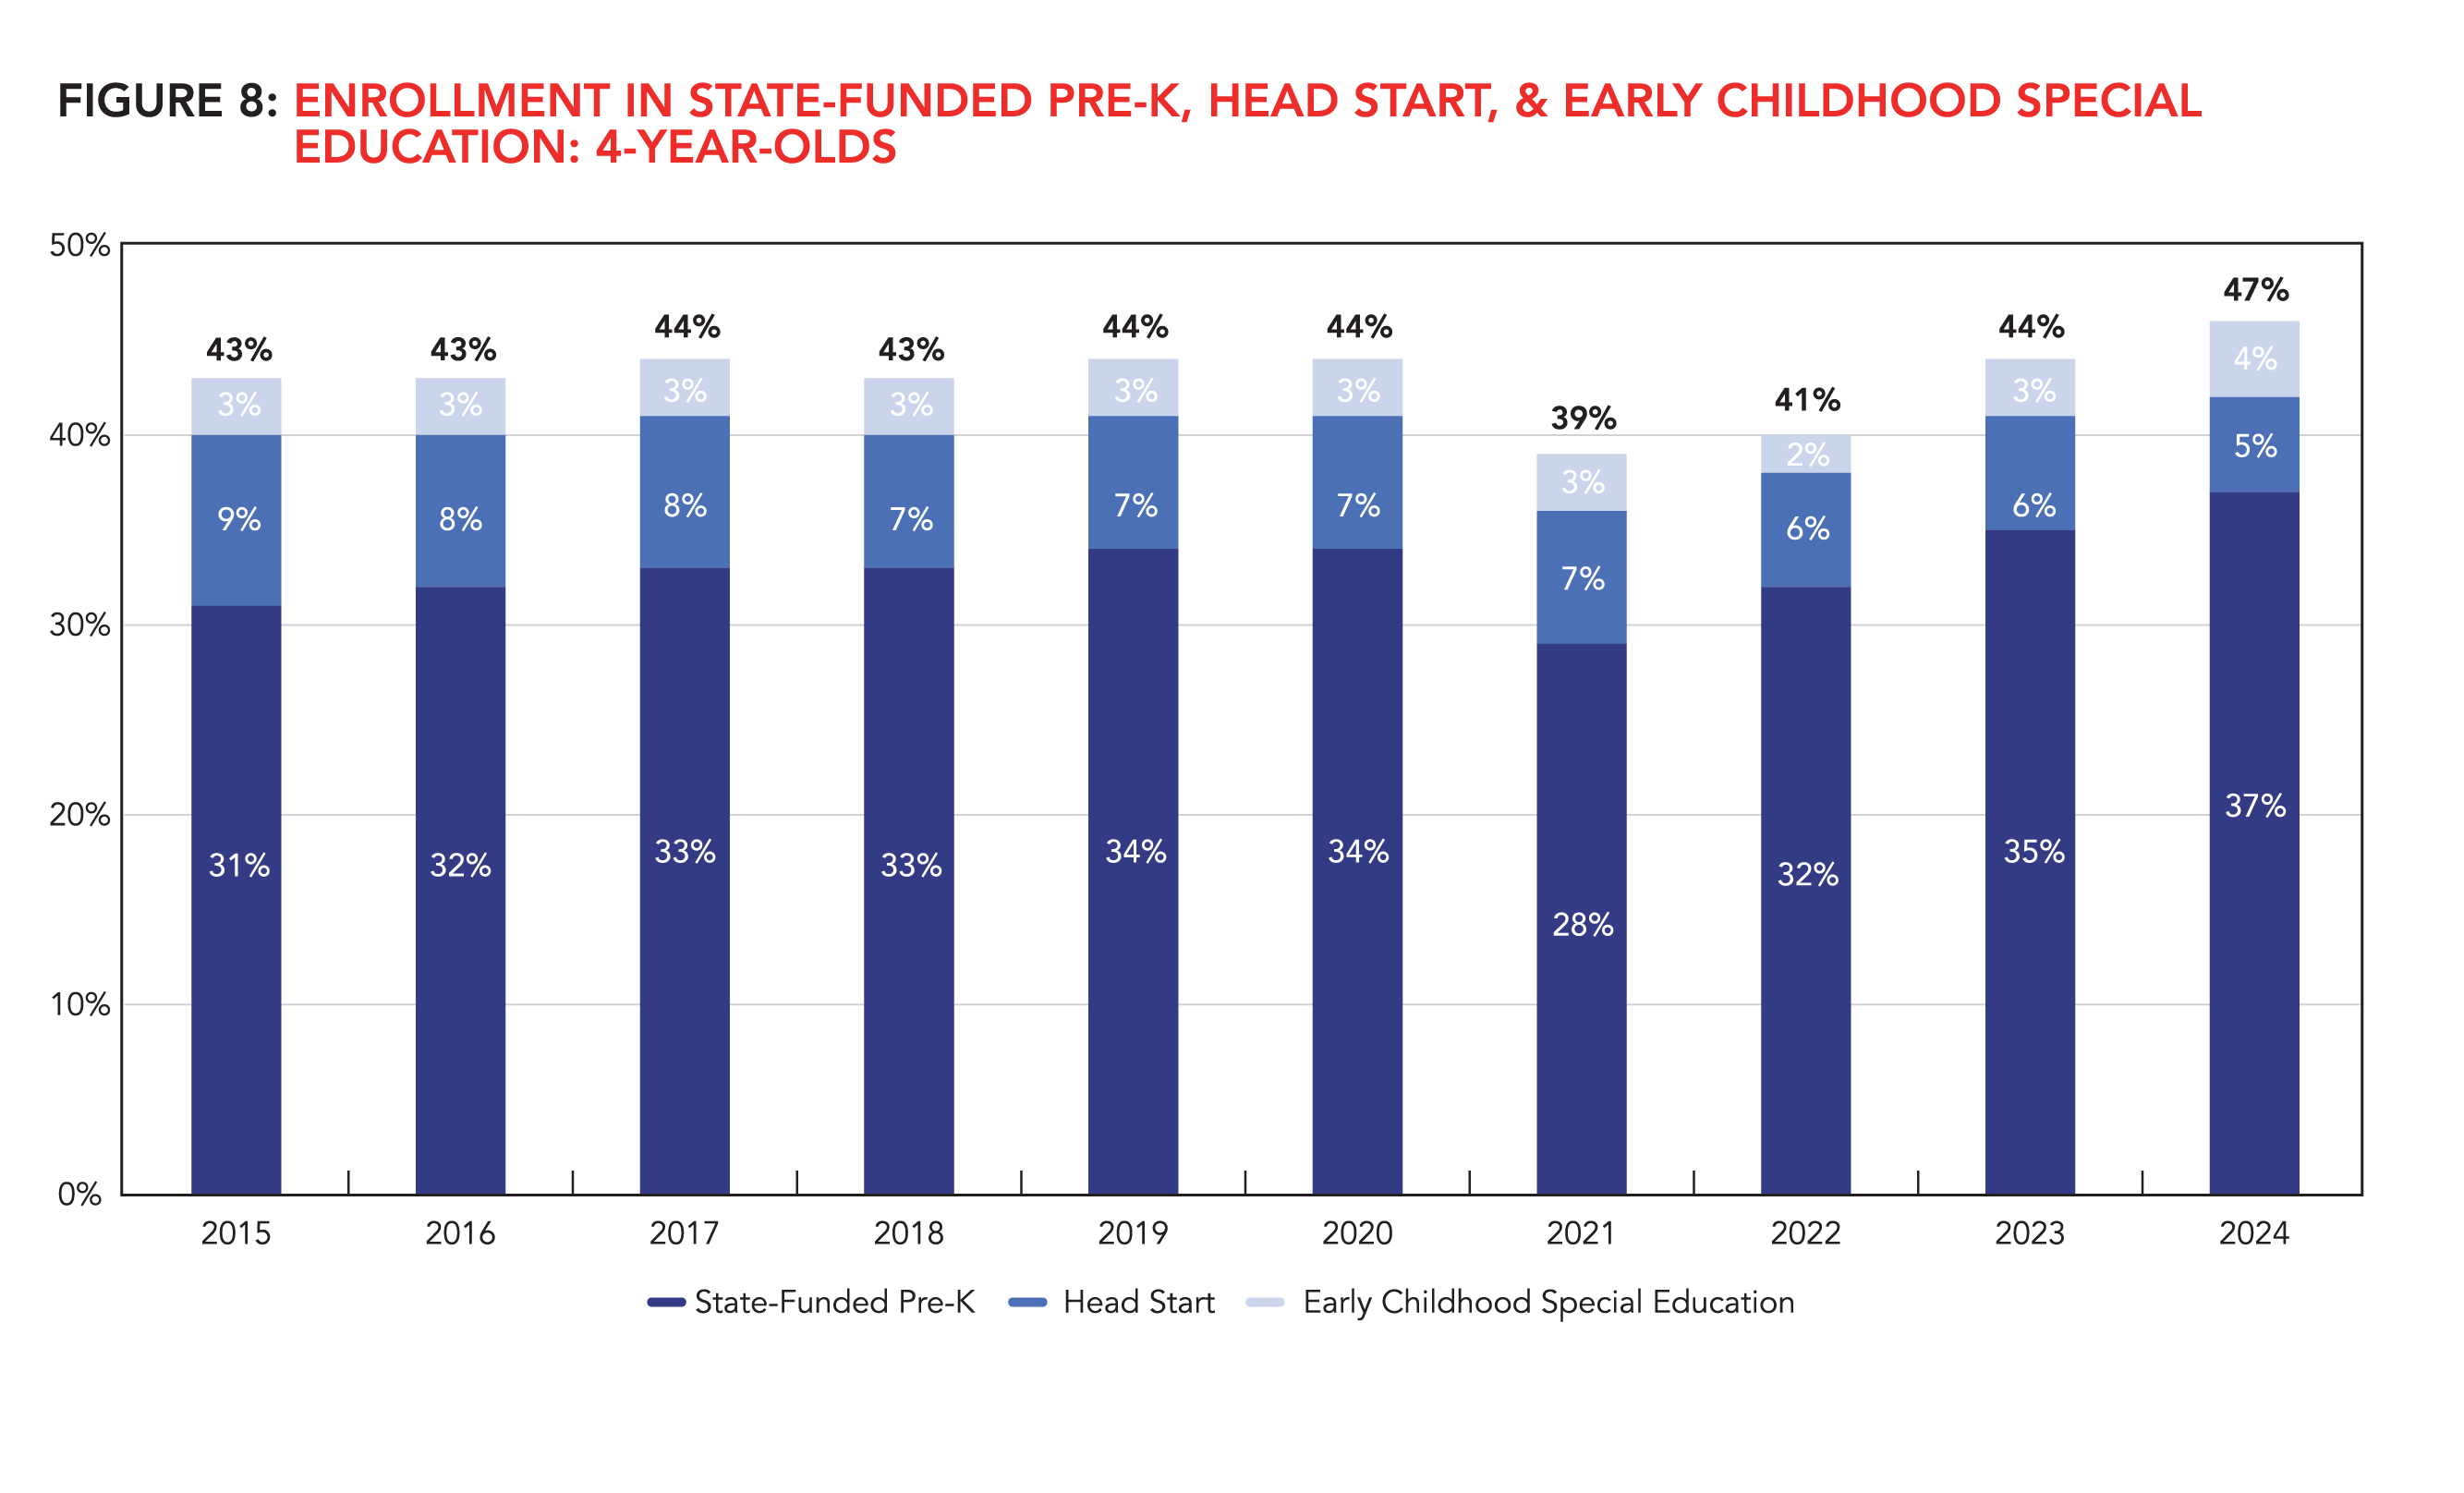
Further attention should be given to the sources of low enrollment in publicly-funded preschool programs. Are parents dissatisfied with quality or with limited hours that do not meet child care needs for working families? Does lack of transportation limit access? As the District of Columbia and Vermont have by far the highest enrollment rates in very different contexts, states with much lower enrollment in universal programs could look to them for advice. The importance of state leadership in recognizing and seeking to influence federal policy impacts on states is evident from examining trends in combined (unduplicated) enrollment across state pre-K, Head Start, and early childhood special education. States increased 4-year-old pre-K enrollment by six percentage points over the last decade, but because Head Start decreased enrollment at age 4, there was only a three-percentage point increase overall (See Figure 8). Although that decrease in Head Start enrollment results from an increase in the percentage of children served for a full school day and shift in funding toward Early Head Start, it impeded progress toward serving all 4-year-olds in poverty and undercut the progress made by states to expand ECE access. If federal proposals to defund Head Start are enacted, state ECE progress will be undercut with some states totally overwhelmed by decreased ECE access at both ages 3 and 4. Table A and Table 4 show how ECE enrollment would decrease in each state if Head Start is defunded. These decreases reflect not just the reduction in unduplicated enrollment but the loss of enrollment for children jointly funded by Head Start and states in partnership.
FUNDING LEADERS
Four states — California, New Jersey, New York, and Texas — each spent $1 billion or more on preschool in 2023-2024. California alone spent more than $3.8 billion. Preschool spending in these four states accounted for 51% of all state preschool spending in the nation. As these states have just 30% of the nation’s children and 41% of its pre-K enrollment, their outsized impact reflects both serving higher proportions of the population and higher spending per child. At the other extreme, four states with programs — Alaska, Hawaii, North Dakota, and Utah — each spent less than $10 million.
To compare funding adequacy across states adjusting for the numbers of children served, one must examine funding per child. The District of Columbia ranked first as it spent $23,785 per child, followed by Oregon ($18,637) and New Jersey ($17,911). At the other end, 13 states with programs spent less than $5,000 per child (See Table 6). Although in some states local sources supplement state funding, this is not always the case, and funding per child from all sources also varies widely across states. Dependence on local funds also means that funding per child can vary greatly within states, though data are not available on this variation.
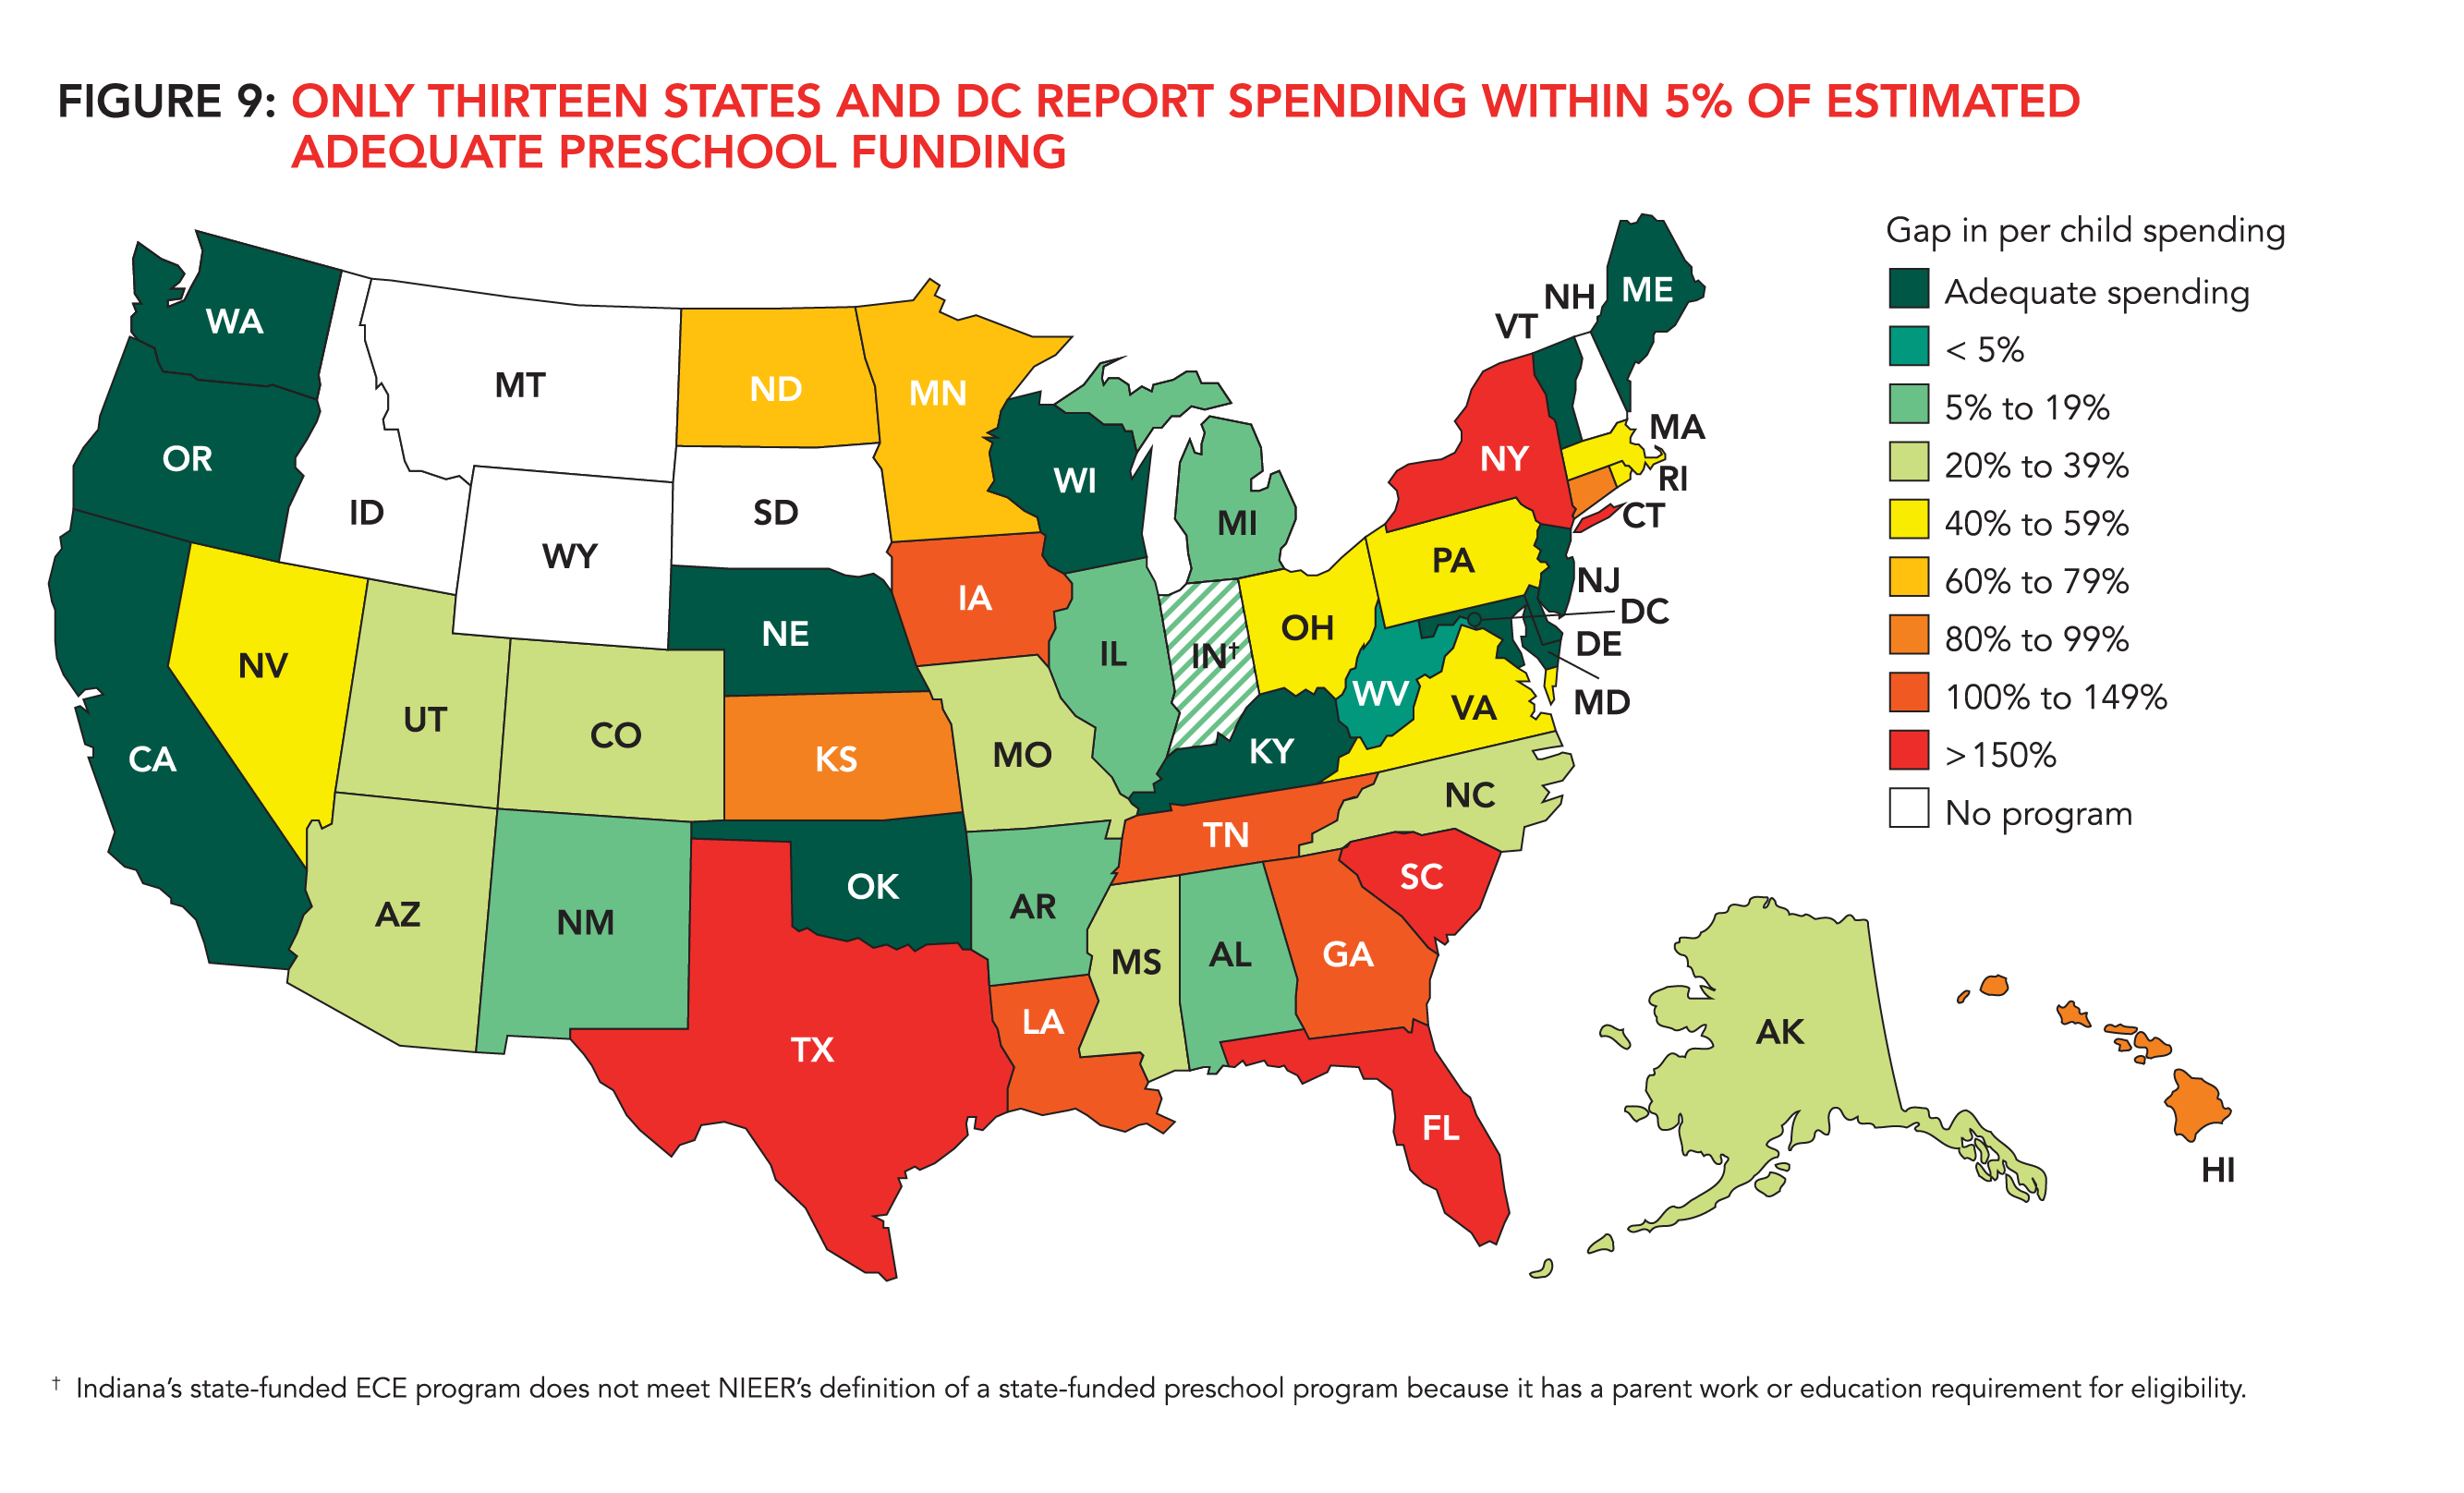
To better assess funding adequacy, we estimated how much each state needs to spend per child and in total to support minimum quality standards and provide K–12 pay parity for preschool teachers within their current operating structures (half-day and/or full-day). Table B shows estimates of how much each state should spend per child and for all children currently enrolled. A limitation is that some states cannot report all the funds supporting state-funded pre-K. This leads to uneven comparisons across states and underestimates of spending adequacy. Despite these shortcomings, we can be reasonably certain that 15 states spend enough to meet these standards. In another eight states, reported spending is less than half of the cost to meet minimum standards, which is an unreasonably high gap for local spending to fill. For other states, the situation is less clear. Estimated gaps in spending are shown in Table B and Figure 9.
QUALITY STANDARDS LEADERS
Alabama, Hawaii, Michigan, Mississippi, and Rhode Island are the only states to meet all 10 of NIEER’s benchmarks for minimum quality standards for preschool. Other states come close with nine benchmarks including Delaware, Maine, New Jersey, New Mexico, North Carolina, Oklahoma, Tennessee, and West Virginia. Some states with multiple programs have one of their programs at this level but not all. Not surprisingly, none of the programs meeting 9 or 10 benchmarks are among the lowest spenders per child, and most provide strong financial support. Some of these quality leaders also offer universal programs and have either attained or are moving rapidly toward high enrollment rates.
Although much can be learned from many state leaders, we highlight Alabama, Michigan, New Mexico, and Oklahoma as having strong lessons for other states despite taking different paths. These are described briefly in the states highlighted below.
Footnotes
- 1Organization for Economic Cooperation and Development (OECD), Online Education Database, retrieved September 16, 2019, from http://stats.oecd.org/Index.aspx. See Digest of Education Statistics 2019, table 601.35. NCESE (2020). The Condition of Education. Chapter 4/International Comparisons. Retrieved from: https://nces.ed.gov/programs/coe/pdf/coe_cgh.pdf
Four All Around Leaders
Alabama has been a leader in expanding access to quality preschool for almost two decades. The First Class Pre-K (FCPK) program has set and maintained standards that meet all 10 of NIEER’s quality standards benchmarks. Alabama prioritizes quality over rapid growth. The program has grown enrollment gradually but steadily, reaching 41% in 2023-2024 while maintaining quality standards without reducing funding per child. Alabama’s program also stands out for supporting salary parity for teachers to enhance quality and prevent nteacher shortages and for a 6.5 hour per day to better support child development and parental employment. FCPK’s funding model includes start- up funds for classrooms to support growth and grants to help programs improve quality to support effectiveness. The state has also benefited from support from the business coalition which has built strong political support for preschool. Evaluations indicate that FCPK improves participants’ long-term educational outcomes. 1
New Mexico is a preschool rising star. The New Mexico PreK program (NM PreK) meets 9 of 10 NIEER quality standards benchmarks (missing the teacher degree benchmark because lead teachers in nonpublic schools are not required to have a bachelor’s degree). Since 2005-2006 enrollment in NM PreK has grown gradually, but in the last few years it has skyrocketed. Between 2022-2023 and 2023- 2024, enrollment of 3-year-olds increased by 10 percentage points, almost doubling, and enrollment of 4-year-olds increased by six percentage points, surpassing 50% for the first time. This growth alone is remarkable, but it occurred at the same time the state shifted toward greater provision of school-day slots, increased the annual hours for a school-day slot from 900 to 1,080, and added a new extended plus program that provides year-round pre-K. Funding per child has also increased in recent years to both cover more hours and to increase salaries for lead and assistant teachers. Lead and assistant NM PreK teachers in public schools have salary parity with other public school teachers. This progress was made possible by a new dedicated funding source: revenues from New Mexico’s Land Grand Permanent Fund (LGPF). The LGPF is a sovereign wealth fund based on leases and royalties from natural resources. In 2022, voters approved a constitutional amendment requiring a 1.25% distribution from the fund to provide early childhood education. The amendment was passed by more than 70% of voters. 2 Other states that might consider such a step because they have large sovereign wealth funds are Alaska and North Dakota.
Michigan has been a long-time leader in quality and has recently begun working towards universal preschool. Like Alabama, Michigan’s policies meet all 10 of NIEER’s quality standard benchmarks which are embedded in state policy. Enrollment in Michigan’s Great Start School Readiness Program (GSRP) has increased slowly, but in recent years the state has prioritized serving more children in school-day programs (6.5 hours per day) and fewer children in part-day programs (3 hours per day). One key to creating school-day slots has been through GSRP-blended slots that are funded partially by GSRP and partially by Head Start. The state has also increased funding for GSRP in recent years, raising the per child rate significantly. GSRP funding includes funding for transportation, curricula and training on curricula, and outreach to parents. To reach the stated goal of universal preschool for 4-year- olds, Michigan has increased the income- eligibility limit for priority enrollment, up to 400% of the federal poverty level for the 2025-2026 school year. 3
Oklahoma was one of the first states to have universal preschool for 4-year-olds, and it is offered in all school districts in the state. 5 Currently the state enrolls 66% of 4-year-olds in its Oklahoma Early Childhood Four-Year-Old Program. The state also supports a small percentage (6%) of 3-year-olds in preschool. Oklahoma’s preschool program meets 9 of 10 NIEER quality standards benchmarks, falling short on requirements for assistant teachers, something the state is working on improving. Oklahoma built in quality from the start by requiring that all teachers meet public school teacher standards and be paid as public school teachers. Preschool is funded through the school funding formula and state, local, and federal (to a lesser extent) funds support the program. Rigorous evaluations of the program in Tulsa have found numerous positive impacts including a 12 percentage point increase in college enrollment. 5
Oklahoma experienced a declining K-12 population a quarter century ago and was perhaps the first state to recognize that the problems this caused (e.g., school closures, lost economies of scale) could be addressed by adding universal preschool to the public education system.
6
States facing large declines in K–12 population today that might learn from Oklahoma include California, Hawaii, Louisiana, Mississippi, New Mexico, New York, Oregon, and West Virginia. Some of these states seem to have already started down a similar path to Oklahoma. As 40 states are predicted to experience some decline in K–12 enrollment, most states should monitor this trend and consider pre-K expansion as an approach to
dealing with the problems and opportunities associated with declining enrollment.
7
As discussed earlier, Oklahoma is one of the leaders in universal pre-K that has experienced a long-term decline in the percentage of children enrolled from its peak in the last decade. Why this has occurred is something of a mystery. However, Oklahoma and the other states with similar downward trends should be considered “canaries in the coal mine,” early warnings of a problem that others may experience and that needs to be addressed. In particular, states need to ensure that children in the most economically disadvantaged families enroll in preschool at very high rates (90% or more) as the payoffs are biggest for these children. It may not be a coincidence that Head Start programs targeting young children in poverty also have experienced more enrollment problems in recent years.
Footnotes
- 1First Class Pre-K Research Evaluation Team (2020). Alabama’s First Class Pre-K Program: Outcomes and Impacts: A Summary of Results. Retrieved from: https://www.children.alabama.gov/wp-content/uploads/2021/09/Alabama-FCPK_Summary-of-Research-Evaluation-Results_January-2020.pdf
- 2https://www.michigan.gov/mileap/early-childhood-education/early-learners-and-care/gsrp (Accessed April 2025)..
- 3https://en.wikipedia.org/wiki/New_Mexico_Land_Grant_Permanent_Fund#cite_note-13 (Accessed April 2025).
- 5 a b Gormley, W. (2024). Universal Pre-K in Tulsa: A Surprising Success. The Journal of the National Association of State Boards of Education, 24. https://www.nasbe.org/universal-pre-k-in-tulsa-a-surprising-success/
- 6https://www.newson6.com/story/5e367f022f69d76f620929e0/census-finds-fewer-schoolage-children-in-oklahoma. Accessed April 2025.
- 7NCES (2023). Table 203.20. Enrollment in public elementary and secondary schools by region, state, and jurisdiction: Selected years, fall 1900 through fall 2023. Retrieved from: https://nces.ed.gov/programs/digest/d23/tables/dt23_203.20.asp
What’s New: The Details
RESOURCES
- Total state spending for preschool programs reached an all-time high of $13.6 billion across 44 states and the District of Columbia.* Six states still did not fund a preschool program meeting NIEER’s definition in 2023-2024, though Indiana offers a program that provides similar services but with eligibility limited by a work or school requirement. States reported spending $257 million in federal COVID-19 relief funding. States’ use of COVID-19 relief funding declined by almost half since the prior school year, and that funding source will no longer be available.
- Including COVID-19 relief dollars, spending on state-funded preschool increased by $1.93 billion (17%), adjusted for inflation, from 2022-2023.
- Average state funding per child enrolled (including COVID-19 relief) was $7,888 in 2023-2024. Adjusted for inflation, this is a $675 per child increase from 2022-2023 (and more than double the increase seen last year).
- All-reported spending, which includes local and federal dollars to the extent that states can report them, topped $15 billion for the first time ever, an inflation-adjusted increase of nearly $2 billion (15%) from 2022-2023. All-reported spending per child was $8,857, an inflation-adjusted increase of $636 from 2022-2023.
ENROLLMENT
- States enrolled more than 1.75 million children in state-funded preschool in 2023-2024, including 1.42 million 4-year-olds and 307,232 three-year-olds. States enrolled 8% of 3-year-olds and 37% of 4-year-olds.
- Enrollment in state-funded preschool reached all-time highs in the total number of children, the number of 3-year-olds, the number of 4-year-olds, the percentage of 3-year-olds, and the percentages of 4-year-olds. Enrollment in state-funded preschool increased by 111,243 children, or 7%. The total number of children enrolled in state-funded preschool increased in all but nine states.
* Consistent with U.S. government statistical practices, the District of Columbia will be referred to as a “state” throughout this report. Hence, we report 45 “states” providing state-funded preschool.
- Nationally, enrollment in state-funded preschool recovered from the devasting impacts of the COVID-19 pandemic. A total of 94,435 more children enrolled in state-funded preschool in fall 2023 than in fall 2019, up 6%. However, progress has been uneven, and many states still enroll fewer children and/or a lower percentage of children than before the pandemic.
- The District of Columbia and 11 states enrolled more than 50% of 4-year-olds in state-funded preschool. The District, Vermont, and Colorado all served 70% or more of 4-year-olds.
- Only the District of Columbia (82%) and Vermont (58%) served more than one-quarter of 3-year-olds. Four other states (Illinois, New Jersey, Kansas, and New Mexico) enrolled more than 20% of 3-year-olds.
- Across all major public programs — state-funded preschool, preschool special education, and Head Start — 47% of 4-year-olds and 17% of 3-year-olds were served. Enrollment in Head Start at ages 3 and 4 decreased between 2022-2023 and 2023-2024 and it remains below pre-pandemic levels as well.
QUALITY STANDARDS
- Alabama, Hawaii, Michigan, Mississippi, and Rhode Island continue to be the only states to meet all 10 of NIEER’s benchmarks for state preschool quality standards.
- Twenty-one state-funded preschool programs met five or fewer of the quality standards benchmarks, including three of the four largest programs (California TK, Florida, and Texas). Forty-four percent of children in state-funded preschool were in a program meeting half or fewer of the quality standards benchmarks. Only 16% of children were in programs meeting nine or ten benchmarks. More than 2.5 times as many children were enrolled in programs meeting five or fewer benchmarks than were in programs that met nine or ten.
- Utah met the Early Learning and Development Standards benchmark for the first time now that their ELDS is aligned with their infant and toddler standards.
- NIEER’s benchmarks are for policies regarding quality standards rather than implementation. However, at some point waivers or “exceptions” to policies – official or unofficial – become so extensive that the de facto policy is different and should be rated accordingly. During the pandemic, waivers to policies became much more extensive and some have continued even as the emergency has passed. As it is unclear yet whether these will be reversed, this year programs received an “*” for standards that were known to not be fully implemented. Five programs received an “*” for the lead teacher degree benchmark. Two programs received an “*” for the continuous quality improvement benchmark.
IMPORTANT DEVELOPMENTS
- Indiana’s On My Way Pre-K program is included in the Yearbook again. Although it does not meet NIEER’s definition of a state-funded preschool program because of its parental work or school requirement, it does provide early education to 4-year-olds. The program is described on its profile page but is not included in national numbers or rankings.
- Several states added additional state-funded preschool programs:
- Alaska began the Alaska Early Education Program Grant and the Alaska .5 ADM Approval Pre-K Program in addition to the Pre-Elementary Program.
- Mississippi began the State Invested Pre-Kindergarten in addition to the Early Learning Collaborative program.
- Missouri began the Missouri Quality Preschool Grant in addition to the Pre-K Foundation Formula program.
- Georgia piloted class size reductions from 22 to 20 with a 1:10 teacher to child ratio that goes into effect in the 2024-2025 school year